


by Subhashish C.
The next Bitcoin Bull Run could be right around the corner, and that’s why today, I’m sharing how I’m personally investing in Bitcoin to capture the maximum upside in the 2024 Bitcoin cycle. I’ll be covering the three long-term indicators that I use to find entries and exits on Bitcoin over the entire Bull Run. Today I’m sharing my views on market trends and investing strategies that I use to build wealth with crypto.
TL;DR
- Right after the Bitcoin halving event happens in April 2024, I will start watching the markets very closely. After the halving happens, usually, there will be a period of consolidation and even some short-term correction where the price goes down. So Bitcoin usually will give one more good entry point as the minor capitulation happens when the rewards are cut in half. I would use the Bitcoin Hash Ribbons indicator to watch when this happens, and when it flashes a blue Buy Signal, I will jump on it.
- After the halving consolidation, Bitcoin’s price should be trading above the 21-weekly EMA level, which indicates that the Bull Run has started. So if there’s any volatility or a Bitcoin correction, I’ll keep holding my position as long as Bitcoin remains above the 21-weekly EMA level. This reassures me that the price drop is only a short-term correction instead of a market top, and I can also use these dips to buy more.
- When do I sell? Well, I’ll take profits together when Bitcoin breaks below the 21-weekly EMA and remains below it for three to four weeks, or if the price makes a dramatic move and drops 15 to 20 percent below the EMA level. Then I will also sell my entire position.
With the next Bitcoin halving coming in April 2024, the next Bitcoin Bull Run could be there before we know it. The Bitcoin halving is one of the most important events in a four-year crypto cycle, and it usually marks the beginning of a new long-term uptrend. I just published an article specifically about how I think the halving will impact Bitcoin’s price, so definitely read that one after.
While buying and holding is generally a more profitable strategy than day trading, I still like to follow the market closely to identify when the Bitcoin cycle actually starts repeating itself. I do this by using three main indicators that determine the long-term entry and exit points on Bitcoin and whether we are in a bull or bear market. So without further ado, let’s get into them.
Stock-to-Flow Model
The first macro indicator I use is the Stock-to-Flow Model. Bitcoin is the stock-to-flow model. This model is best for quantifying the supply and demand shifts of Bitcoin after each halving event. If you’ve been following Bitcoin for a couple of cycles, you may know that the stock-to-flow model has received its fair share of praise and criticism, especially over the last couple of years.
The stock refers to the number of Bitcoins in the circulating supply, while the flow refers to the newly minted Bitcoins that are added per year to the existing supply. When we combine these two metrics, stock-to-flow tells us the scarcity of Bitcoin based on the existing supply and the new supply inflation. This general metric can be used to compare Bitcoin with other asset classes for their levels of scarcity. Most commonly, we can use this model to compare with commodities like silver and gold.
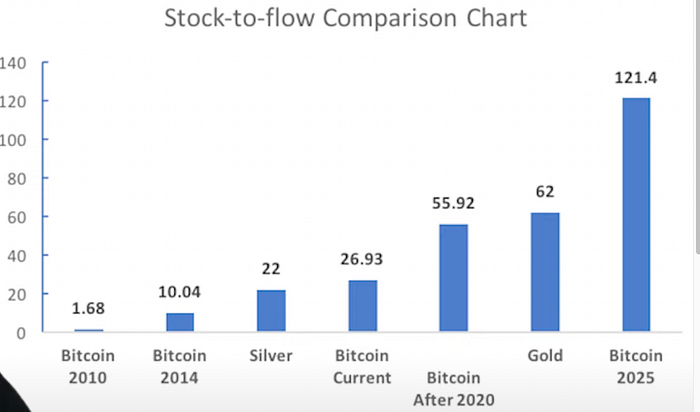
Now, to get our stock-to-flow ratio, we take the current circulating supply (aka the stock) and divide it by the new coins that will be added per year (aka the flow). The idea here is that the higher the stock-to-flow ratio, the more slowly the current supply gets diluted, and thus the more scarce an asset is. Scarcity has a direct correlation with an asset being more valuable. Bitcoin’s stock-to-flow ratio was only about three in its first cycle, meaning it wasn’t very scarce initially. Then, after the 2012 halving, it went to 10, and after the 2016 halving, it rose to 25. The current stock-to-flow ratio is 58 for Bitcoin, which has been relatively consistent since the last halving happened in 2020, and after the next halving in 2024, it will jump to 120.
I’ll say, first of all, that this ratio chart is great for understanding the increased scarcity of Bitcoin, but where it falls short is the actual price predictions. Even from the limited data samples from the last three cycles, there can be a large variance in the price target it predicts and what actually happens. For example, Bitcoin went over the model-predicted price during the bull markets of 2014 and 2017, while in the latest bull market in 2021, it only reached a predicted price of 50k but has since fallen below this target during the bear market.
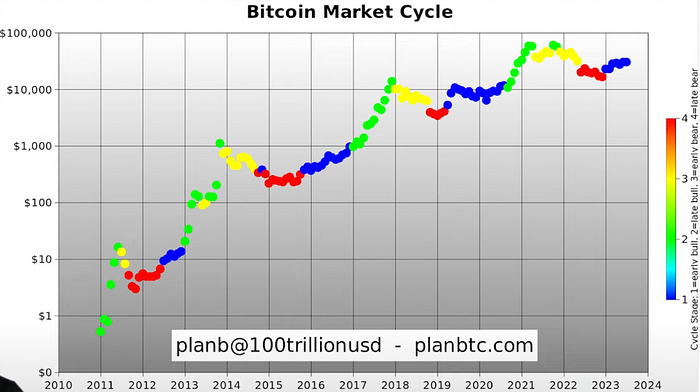
The stock-to-flow model predicts Bitcoin is going to 475,000 in the next cycle, but because of the variance we’ve seen in the past, I’m going to take this price prediction with a large grain of salt. That’s not to say this model isn’t valid. I have found that the stock-to-flow model has generally been accurate in predicting the start of the bull market and the market peak times in relation to the Bitcoin halving events and the stock-to-flow ratio.
The color dots on this stock-to-flow chart represent the number of days until the next Bitcoin halving happened, and this color range starts from red, which indicates the start of the halving cycle, and ends in blue, which is the end of the four-year period. Notice how the red to orange cycle periods tend to represent the initial stages of the uptrend, the green color periods are usually where the cycle tops out, and then the blue periods are the deep bear market phases, best for accumulation. I find that using these color codes splits up the cycle into simple three phases: accumulate in the bear cycle periods (which is right now), watch for when the cycle turns red (which is right after the Bitcoin halving when the next uptrend starts), and then aim to take profits when the cycle color turns green.
Hash Ribbons
The second indicator I use on a long-term basis is the Hash Ribbons. This indicator also helped me predict the Bitcoin bottom back in November of 2022. The Hash Ribbons indicator is based on the global hash rate of Bitcoin mining. Bitcoin’s proof of work mechanism requires powerful computers to solve cryptographic hash functions to produce new Bitcoin blocks. This process runs 24/7 and is the foundation of every Bitcoin transaction and keeps the network secure. The metric used to measure this computing power is called the hash rate.
Here’s why this metric is important when analyzing Bitcoin’s price: since miners rely on mining Bitcoin to generate profit, measuring the hash rate of the Bitcoin network can directly tell us how the Bitcoin miners are doing in their business, which also acts as a significant indicator for Bitcoin’s price action. When we see Bitcoin’s hash rate drop, this is usually when Bitcoin’s price bottoms. Miners are seen as some of the most resilient players in the Bitcoin ecosystem. Whenever they are being pressured, it means that the market is at a critical level due to either a Black Swan event or the halving. During these periods, new players will come into the market to replace the old and ultimately mark the great entry points in the Bitcoin cycle.
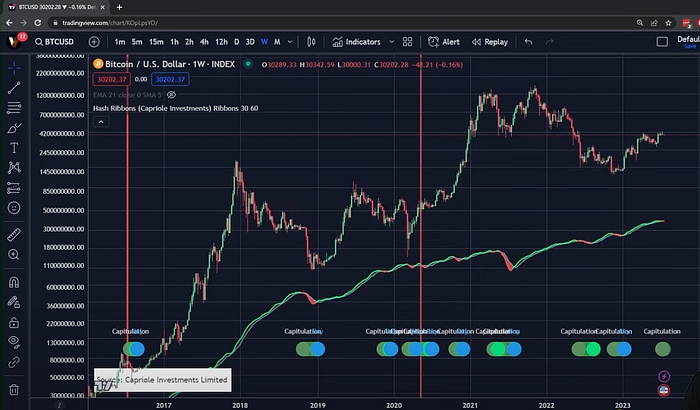
To access this indicator, it’s also free; you can go on TradingView, and under the indicators, just type in “Hash Ribbons,” and the most popular one with 13,000 likes is the one you want. The Hash Ribbons indicator combines the data of the hash rate of the Bitcoin network with the price of Bitcoin. This indicator looks at the relationship between the 30-day and the 60-day moving averages for the hash rate to determine whether the hash rate is falling sharply and when it starts to rebound. You can see this on the indicator chart; the gray line is the 60-day moving average (the long-term moving average), and the green line is the 30-day short-term moving average. Whenever the green moving average line (the short-term) drops below the gray line (the long-term average), the signal fires, and the signal turns red, which means the hash rate is dropping very sharply. Then, this indicator also takes into account the 10-day and 20-day moving averages of Bitcoin’s price, which indicates when Bitcoin’s price starts to rebound and when the moving averages of the Hash Ribbons also start to rebound, marking the price bottom.
So here’s how to read this indicator in a nutshell: the indicator has three stages, with a blue Buy Signal as you can see a little circle at the very end. The first stage is the minor capitulation, where the 30-day moving average hash rate falls below the 60-day moving average, and the hash ribbons chart turns red. This tells us that the miners are starting to feel pressure and turning off their machines. The second stage is to identify when the 30-day moving average rises above the 60-day moving average again on the hash rate, and the hash ribbons chart becomes green again. And the last and final stage is to look for the 10-day moving average of Bitcoin’s price to rise above the 20-day moving average, which is essentially Bitcoin’s price continuing to rebound after capitulation. This signals a recovery in Bitcoin’s price momentum as well as the Bitcoin hash rate, which means the minor capitulation is over, and the price has bottomed.
And as you can see at the very end here, it gives us a blue Buy Signal, which is my signal to buy. Now, this signal doesn’t fire very often, but when it does, it usually produces a really strong buying signal, and I’ve marked them out here on the chart.
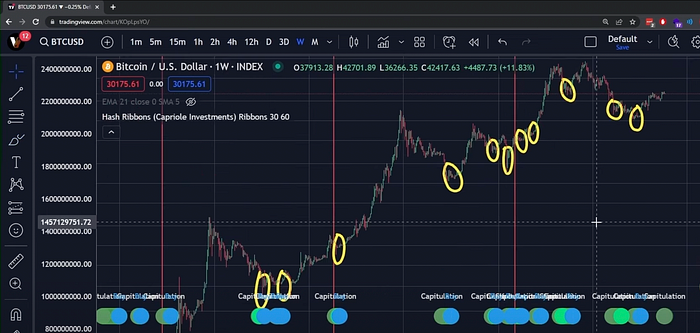
Historically, there have only been about 15 times that it has ever fired, but pretty much every time, it has either marked a local bottom or a cycle bottom. Specifically, this indicator is really spot on at identifying two types of buying opportunities. The first type of opportunity is when there is a significant market downturn and the price of Bitcoin drops so much that these smaller miners are no longer profitable and are forced to stop their operations (AKA minor capitulation). We can see these signals way back in the 2015 Bitcoin bear market bottoms where the price dropped to as low as 200 from the cycle top of a thousand dollars. Similarly, in the 2019 bear market crash where the bottom was around six thousand dollars, this signal also fired then. In the COVID flash crash where Bitcoin dropped from 10,000 all the way down to four thousand in a single day, it also fired. And then more recently, in 2022, during both the Luna crash and the FTX crash, this signal fired twice. Do keep in mind that this signal can also fire at local bottoms when the price drops during a raging bull market, such as around the 30k level in the 2021 bull market. Bitcoin did go on to have another rally, which was a short-term opportunity, but it was at a later stage of the market, so the risk was still high.
The second type of opportunity that the Hash Ribbons identifies is the period of consolidation right after a Bitcoin halving event when the Bitcoin mining reward gets cut in half, and thus the profitability of miners is also cut in half. These are periods where significant market shifts in the Bitcoin mining space happen before the new Bull Run starts. Conveniently, this indicator has all the Bitcoin halving events marked on the chart with these red lines that you can see, and this signal did fire after all three Bitcoin halving events. So right after the 2012 halving, the minor capitulation happened during this sideways consolidation, then again after the 2016 halving, Bitcoin’s price actually dropped a bit right after and started to go on another rally, but this signal did tell us to buy then. And then again, in the 2020 halving, Bitcoin did a similar thing; it went sideways for a few months, which was a great buying opportunity before the Bull Run started, and this minor capitulation signal flashed again, telling us to buy.
With this in mind, I think we should see the Hash Ribbon signal fire again in April of 2024 and leading into the summer of 2024. This tends to happen shortly after the Bitcoin halving events, where Bitcoin stalls in a sideways period due to minor capitulation and due to the cut in rewards. So from April 2024 until the end of summer, I’ll be watching this indicator closely for the Buy Signal. Even though we can’t go back in time to buy the market lows at 16k in 2022, I still think the Hash Ribbon will signal a good spot to buy Bitcoin right before the Bull Run starts in 2024 and probably right after the Bitcoin halving in April.
Okay, now that we have two indicators that give us the macro overview of the Bitcoin cycle and the entry opportunity after the halving event, my final indicator will complete the whole strategy.
Exponential Moving Average or EMA
The third indicator I have used for many years is the Exponential Moving Average or EMA. You can also use a Simple Moving Average, which will show a similar signal, and these are some of the most well-known and simple indicators to use on Bitcoin, but I also find it to be the most effective.
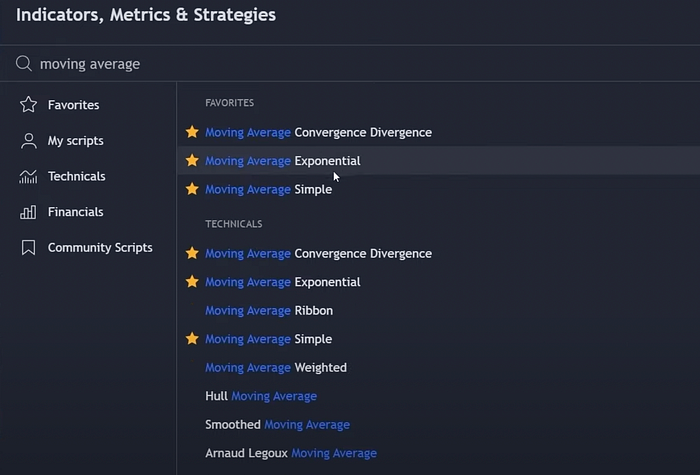
You can find this again on TradingView under the indicators, just typing in “Moving Average,” and either choosing “Moving Average Exponential” or “Moving Average Simple.” Essentially, these moving average indicators take the last X number of candles on the chart and show you an average price of them, and that’s what you see with this blue middle line here on the price chart.
Now, depending on the time frame and settings you give the indicator, this can show vastly different results, so please pay attention to this. The two-time frames I use the most are the 21-weekly EMA and the 200-daily EMA.
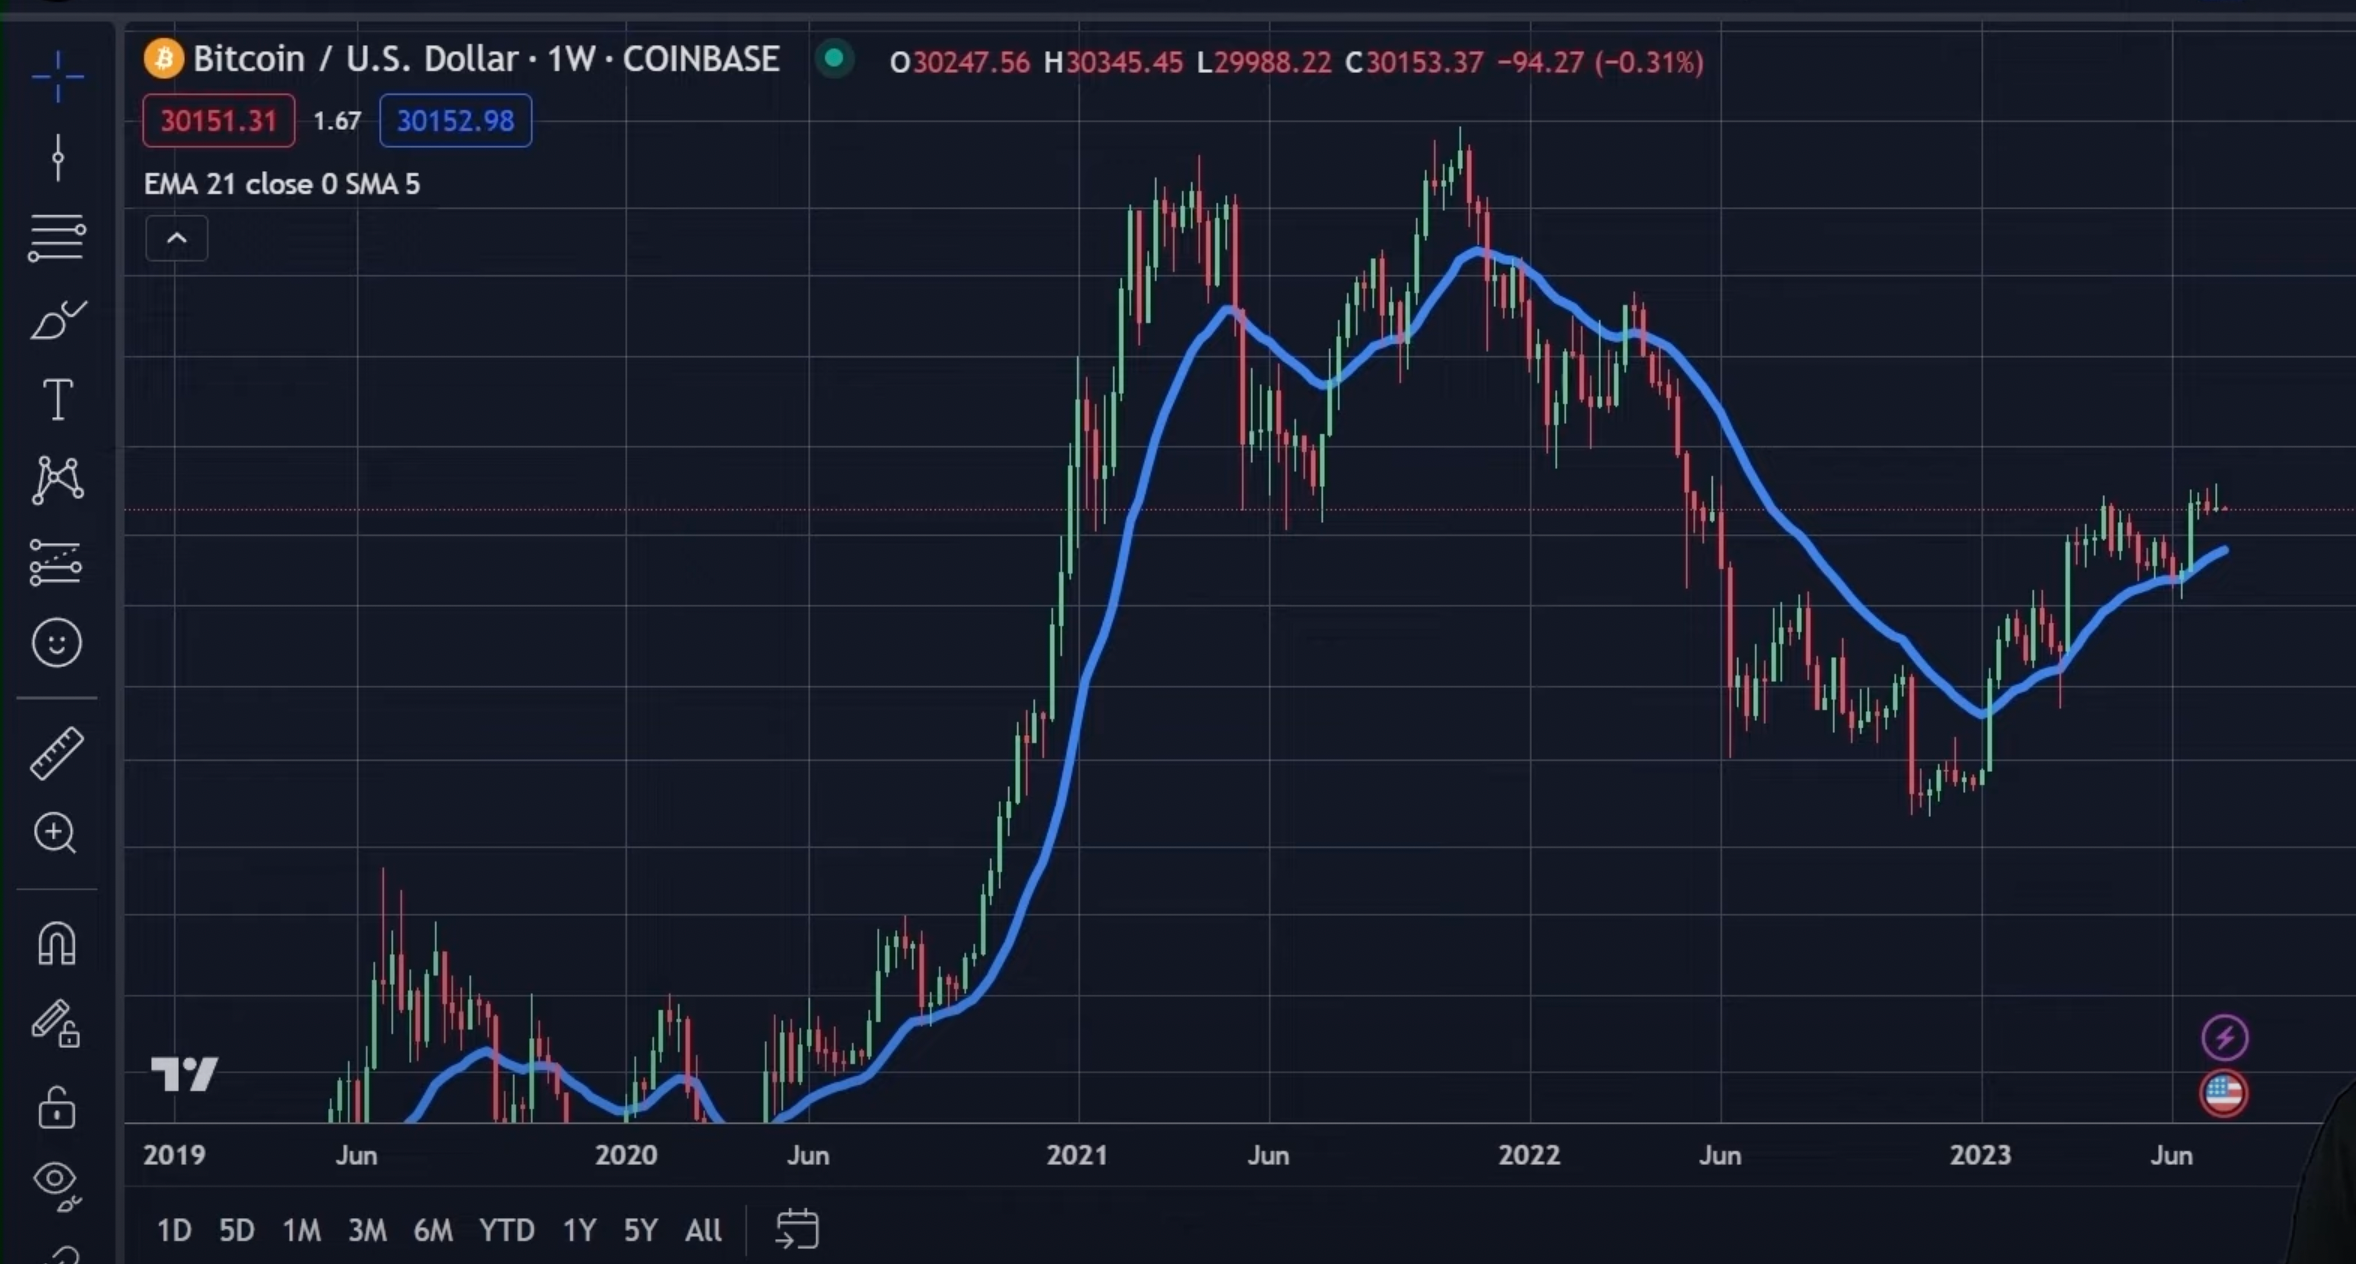
How you can set this is first to go to the one-week time frame, then go into the indicator settings and under inputs, setting the length to 21 for the weekly. Similarly, if you want to use the 200 daily, first go to the Daily time frame, then go into the indicator settings, and change the length to 200. For this video, we’ll be using the 21-weekly EMA as an example. The basic premise is that during a bull market, Bitcoin’s price will stay above the 21-weekly EMA since this level represents a long-term average of the price.
Historically, if the price drops below this level, usually, it means that the price has fallen too sharply too fast, and the uptrend has come to an end. Knowing this, the 21-weekly EMA indicator can tell me whether Bitcoin is in a bull market or a bear market. So let’s look at some of the past Bitcoin cycles to see this in action.

Here’s the 2012 to 2015 cycle. Notice when Bitcoin’s price broke above the blue average line, which is the 21-weekly EMA, and remained above it. This was a super accurate signal for the start of the bull market. For the rest of the Bull Run, Bitcoin’s price always remained above the 21 EMA, and it did test it a few times, but always managed to bounce from it. Then, by the market peak, the price finally crashed below the 21-weekly EMA and could not get above it in the following rally, thus marking the start of the bear market.
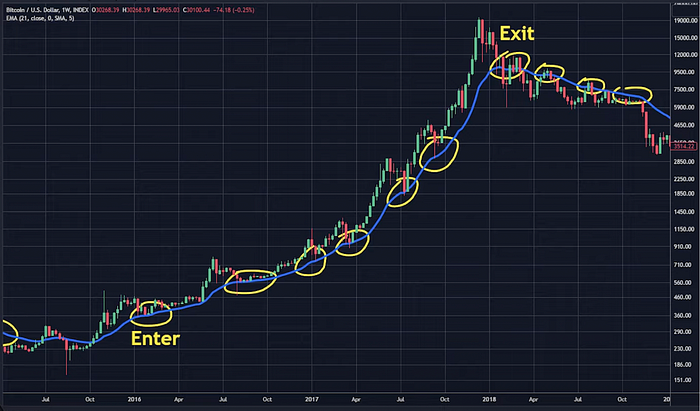
Here’s the 2016 to 2018 cycle as another example. Price got above the 21 EMA and signaled the start of the bull run. It remained above it for the entire run. Then when it finally broke below the EMA line, the bear market started.
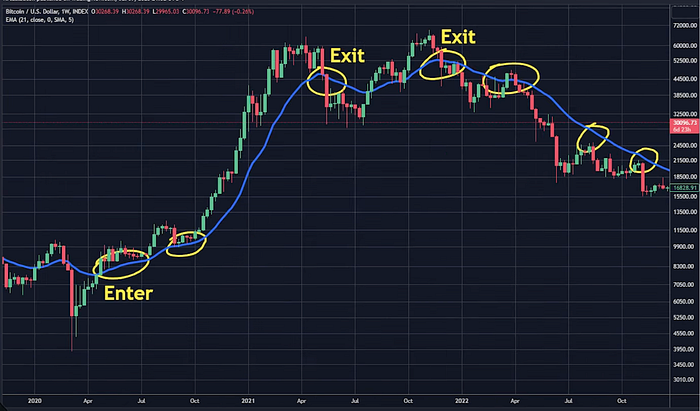
Here’s the 2020 to 2022 cycle. This time around, the indicator was a bit more messy since there was a second peak at the market top, but if you employ the same signal, you would have gotten out at the first breakdown at 40K per Bitcoin, and that still would have been a solid exit.
Okay, now that you know the three indicators, here’s how I’m planning to use them together to invest in Bitcoin in the next cycle:
1. Right after the Bitcoin halving event happens in April 2024, I will start watching the markets very closely. After the halving happens, usually, there will be a period of consolidation and even some short-term correction where the price goes down. So Bitcoin usually will give one more good entry point as the minor capitulation happens when the rewards are cut in half. I would use the Bitcoin Hash Ribbons indicator to watch when this happens, and when it flashes a blue Buy Signal, I will jump on it.
2. After the halving consolidation, Bitcoin’s price should be trading above the 21-weekly EMA level, which indicates that the Bull Run has started. So if there’s any volatility or a Bitcoin correction, I’ll keep holding my position as long as Bitcoin remains above the 21-weekly EMA level. This reassures me that the price drop is only a short-term correction instead of a market top, and I can also use these dips to buy more.
3. When do I sell? Well, I’ll take profits together when Bitcoin breaks below the 21-weekly EMA and remains below it for three to four weeks, or if the price makes a dramatic move and drops 15 to 20 percent below the EMA level. Then I will also sell my entire position.
This is the strategy I used during the 2021 Bull Run, and it’s why I sold most of my positions after the first drop in May of 2021. I got a lot of flack for doing this as the price went on a second rally to 65K. Sure, I might have missed the second peak, but 65K is barely higher than the first peak at 60K, and so many more people got trapped on that second rally, thinking Bitcoin was going to 100K plus.
No matter how high you think the markets can go, you always need to have an exit signal, which you absolutely must obey in your personal belief. For me, this signal is the break of the 21-weekly EMA. This gives me enough buffer in the signal, so I should be able to sell close to the top but not have to aim for the absolute top.
No matter how good of a trader you are, you cannot aim to sell at the absolute top and be that greedy.
Start planning your absolute exit plans now before the Bull Run mania starts. The noise in the Bull Run will make everything much more difficult.
Thanks for reading, and I’ll see you in the next one!
You see, in life, lots of people know what to do, but few people actually do what they know. Knowing is not enough! You must take action. — Tony Robbins