Bankless Writer: Jack Inabinet
(Any views expressed in the below are the personal views of the author and should not form the basis for making investment decisions, nor be construed as a recommendation or advice to engage in investment transactions.)
The month of November was dominated by concerns about the fate of crypto markets. A key crypto exchange that was valued at $32B in June went belly up. A major crypto lending desk went under.
Yet ETH refused to set new cycle lows!
Crypto’s surprising resilience despite market turbulence has degens pondering the age-old question: to ape now or FOMO later?
Inflation is down, the Fed seems to become less hawkish by the day, and global conflicts may be slightly moderating. So what does the on-chain story provide to support this bullish narrative?
Today we’re going to examine 5 on-chain signals screaming “bottom.”
1. Rising Yields
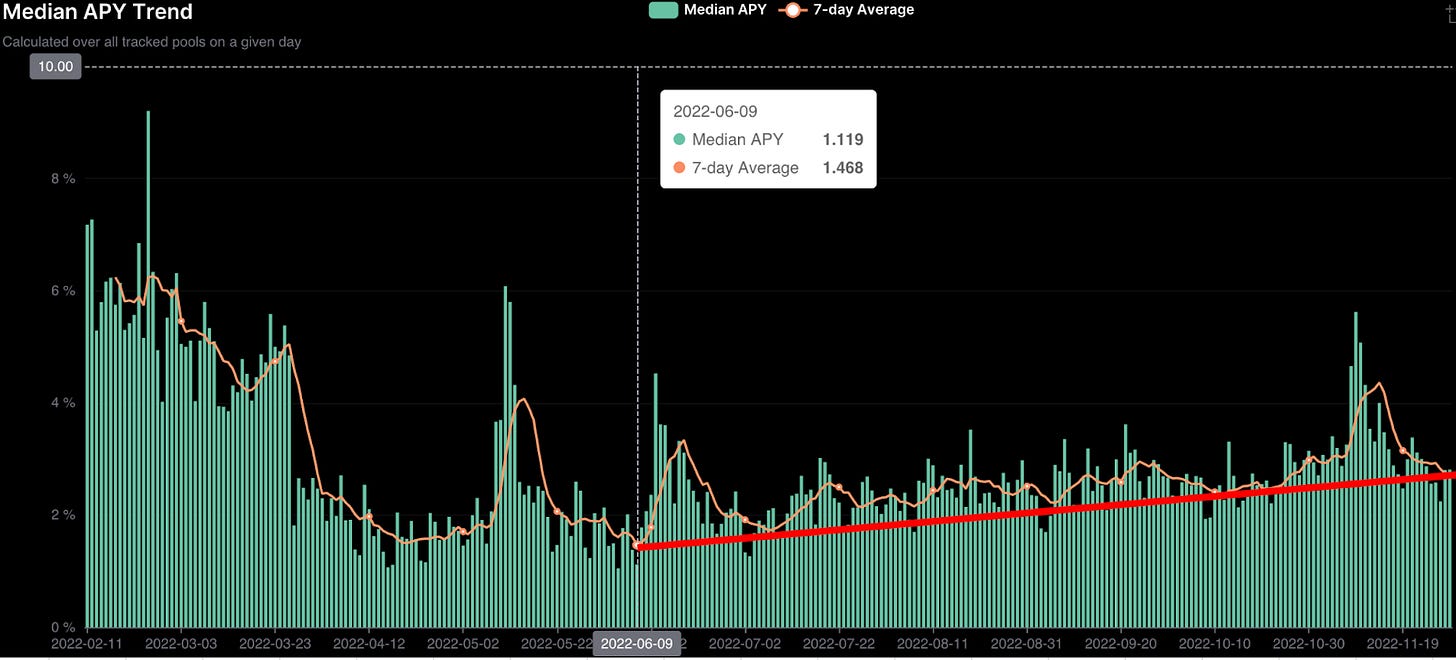
Since bottoming on June 9, aggregate yields in DeFi have been up-only.
Ether reached cycle lows a week and a half later on June 18.
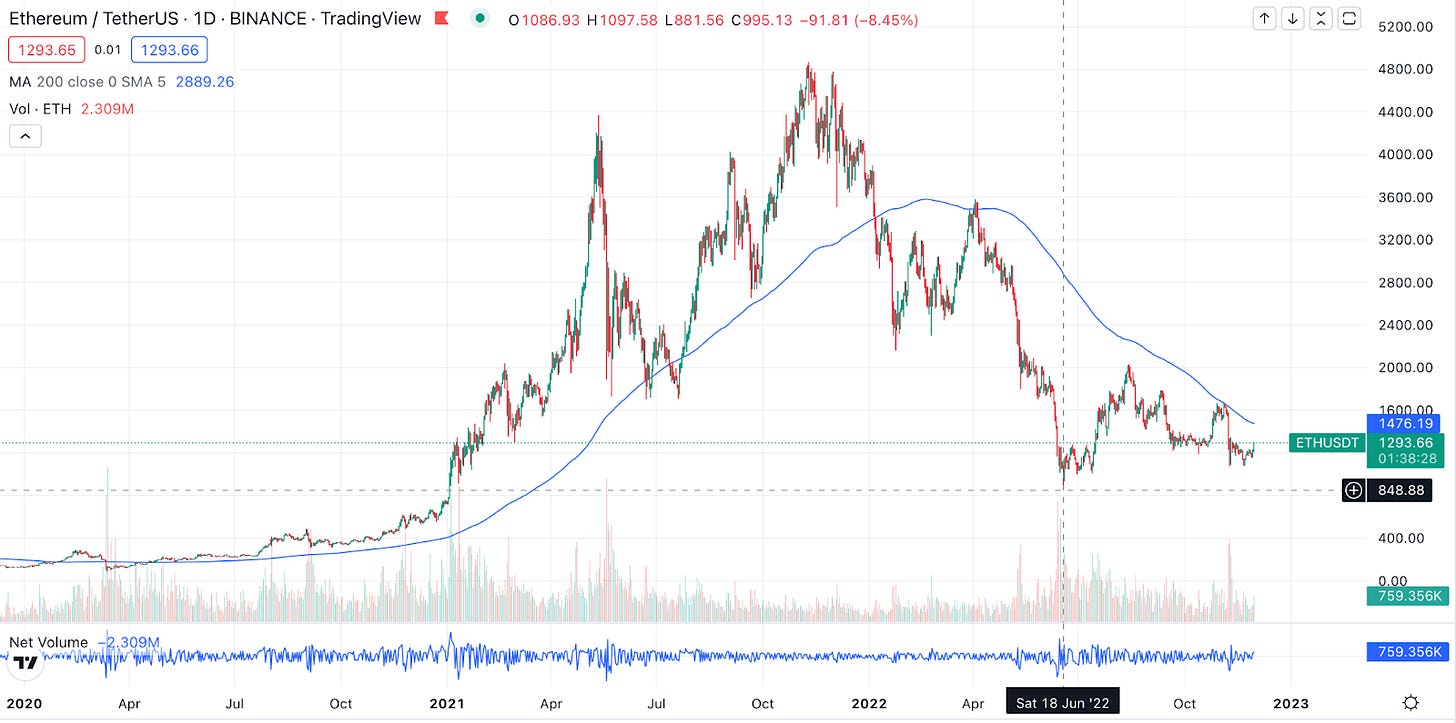
Elevated yields from June 9 to 18 reflect increased borrowing demand for crypto assets, from users opening short positions. After, seven-day moving average media yields locally peaked on June 19 — the day the market saw capitulation in Ether pricing.
Unlike traditional financial markets, where yields on debt instruments from mortgages to commercial paper to US Treasuries are primarily driven by macroeconomic interest rate conditions and Fed interest rate targets, crypto yields are generated from asset demand.
Higher DeFi yields are typically associated with higher crypto asset prices.
Why? Individuals and institutions primarily borrow to access leverage or implement market making or other yield-generating strategies. Higher yields mean borrowers are willing to pay higher costs of capital, indicating better capitalization of borrowers in aggregate. Additionally, increasing yields to borrow signals that borrowers are moving to more risk-on investment approaches, which is bullish for risk-on asset classes, such as crypto.
2. Curve Pools Rebalancing
Remember back when FTX was collapsing and Alameda allegedly shorted USDT, causing it to break its peg (shaded purple box)?
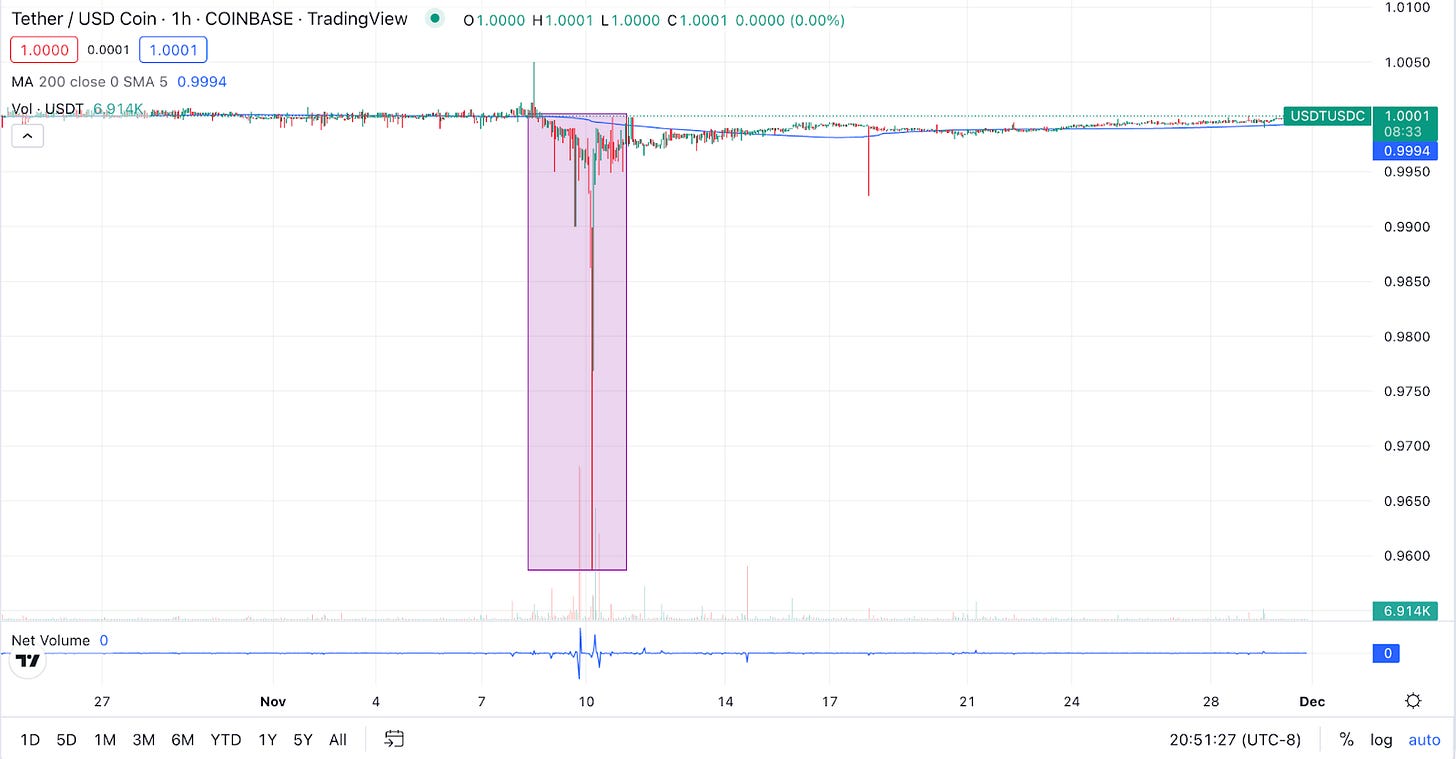
This move from Alameda and the resulting flows from concerned parties decreased the demand for USDT, while simultaneously increasing its supply, causing the peg to break from $1. Due to this sudden supply/demand mismatch, Curve’s 3Pool, arguably the most important and liquid stable-swap pool in decentralized finance, began to see increases in the proportional balance of USDT, when compared to DAI and USDC.

Increased supply from shorting activities, sell pressure from concerned holders, and a lack of demand to absorb increased supply, increases the proportion of USDT in the 3Pool.
During major market drawdowns, the balance of stablecoins often fluctuates from the 1:1:1 targeted level between USDT/USDC/DAI. Recent inflows of USDT have brought the pool towards its intended levels, with 38% of the Curve 3Pool composed of USDT and USDC and DAI both independently composing 31%. The stabilization of the Curve 3Pool, especially after periods of extreme volatility, displays confidence in the backing of major stablecoins.
The 3Pool acts as a barometer for fear within the industry, and the recapitalization of USDT balances is a bullish on-chain signal.
While the proportional relationship between USDT, USDC, and DAI in the 3Pool remains subject to rapid fluctuations, the stabilization of this ratio suggests that the market is expecting calm or positive conditions for the near future.
3. Negative Funding Rates, Stable Prices
Funding rates bring the price of the perpetual futures in line with the spot price of the asset the perp is intended to track.
When there is an exceedingly large amount of open short interest, the price of perpetual instruments will be less than the price of the underlying asset. In this scenario, users in short positions compensate longs via the funding rate. When the price of the future is above the spot price of the underlying, longs will pay shorts via the funding rate. This mechanism encourages the instrument’s tracking of the asset’s spot price.

Throughout the month of November, BTC funding rates have primarily been negative on all major exchanges tracked by The Block’s. In general, positive funding rates imply positive and negative funding rates imply negative price action.
Continued negative funding rates in combination with stable(ish) market pricing, however, provides hope for bulls, displaying the market’s resistance to further drawdowns in asset pricing, despite abnormally high levels of crypto asset sell pressure.
4. Normalizing Volatility Levels
After peaking at a value of $126.02 on November 9 during the the FTX fiasco, the Crypto Volatility Index (CVI), a crypto-native solution for its TradFi, S&P 500 tracking counterpart the VIX, has been down-only, reaching a baseline-adjacent level of $80.71.
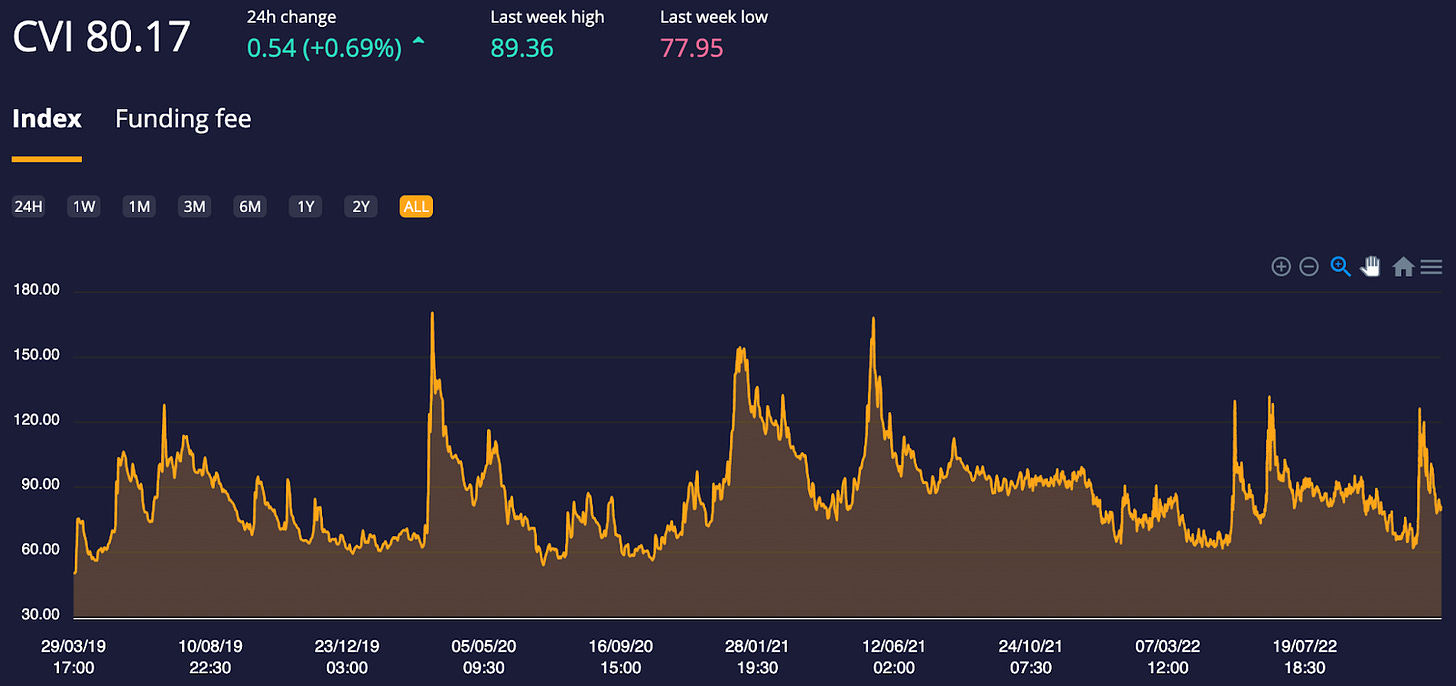
Similar to the VIX, high readings from the CVI are typically associated with adverse market conditions. Today, the CVI sits at similar levels as it did when ETH formed its potential cycle bottom from June to July of this year.
It is necessary for volatility and uncertainty in crypto markets to reduce for a bottom to form. Low CVI readings provide confirmation of this low volatility.
If a bottom is truly forming, we will expect the CVI to continue to fall, as it was prior to November 7, the day the FTX saga truly began to unfold.
5. Smart Money Stablecoin Holdings Down
Smart Money’s allocations to stablecoins have been down-only after peaking at 38% on November 9.
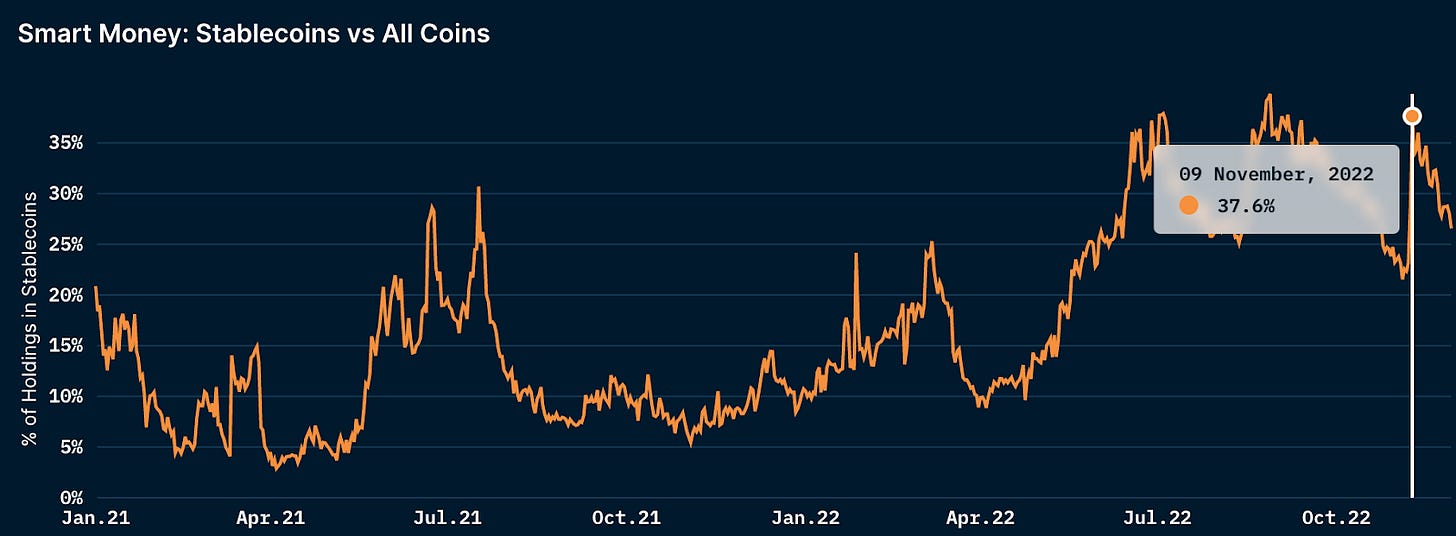
The remainder of November saw Smart Money transitioning from higher stablecoin concentrations in portfolios towards today’s levels. Currently, stablecoins comprise 27% of Smart Money wallet balances.
Much like how stablecoin holders dumped Tether, crypto asset holders transitioned into stablecoins when the future worth of their crypto assets came into question.
Investing in stablecoins allows crypto holders to mitigate risk and limit potential portfolio drawdowns, while keeping funds on-chain and enabling whales to easily redeploy capital as they become more comfortable with market conditions.
While the stablecoin concentration of Smart Money portfolios has a long way to go until it revisits the sub 9% levels it touched in April of this year as ETH rallied to $3.5k, drawdowns in stablecoin allocation by smart money is necessary before a bottom can be fully formed. Currently, this stat is trending towards bullish territory.


