


After the FTX insolvent cases, we wanted to find out how the volume behaves for CEX and DEX. Are there any significant changes after that? Or no changes at all? In this article, we will analyze the data using data from CoinGecko and dune analytics.
CEX volume analysis
- We define the top CEX here as having a high volume on the coingecko page
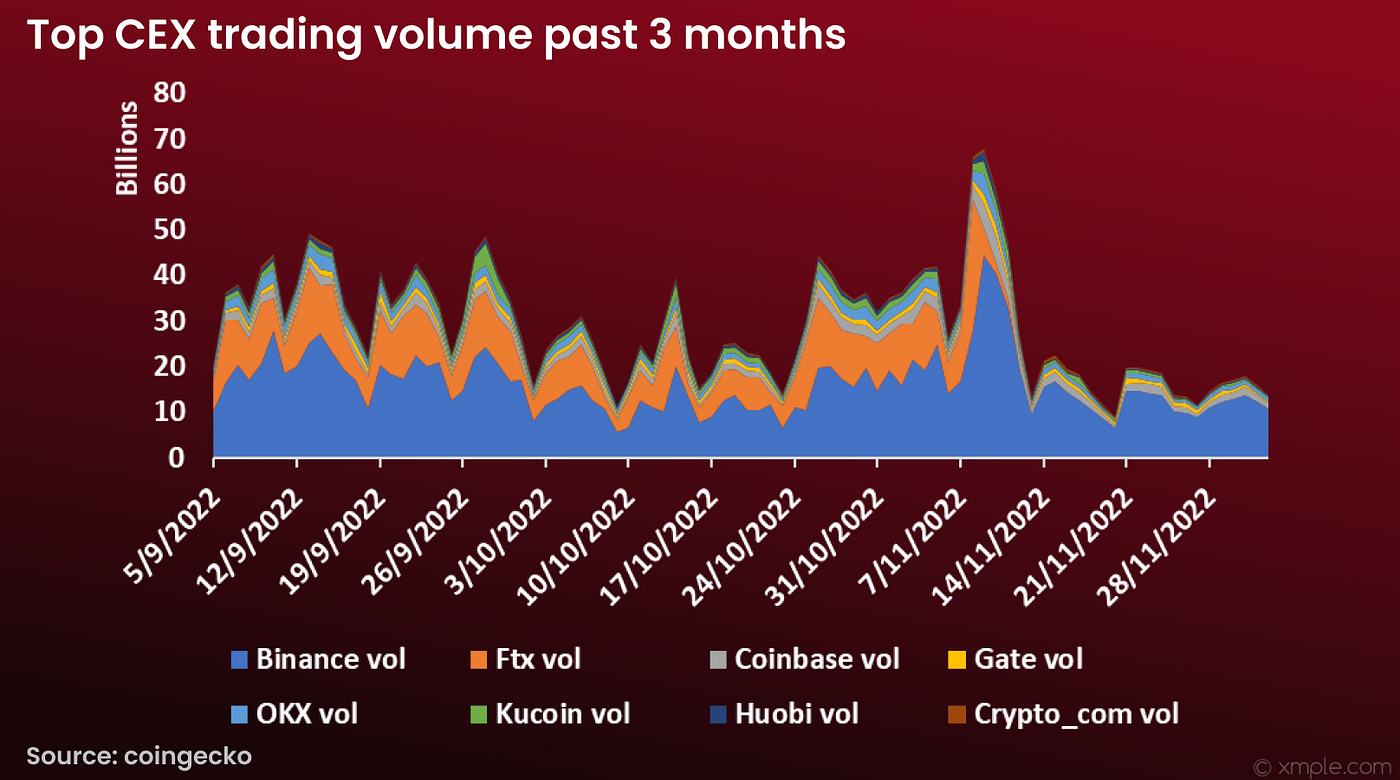
First off, let’s look at how the CEX volume changes after the FTX case. Clearly, we can see after FTX become insolvent, starting on 7 Nov 2022, we see a significant drop in trading volume coming from the top CEX. From an average daily trading volume of more than 30 Billion to now an average of 10 billion trading volume. Who will eat up most of the volume of FTX is gone?
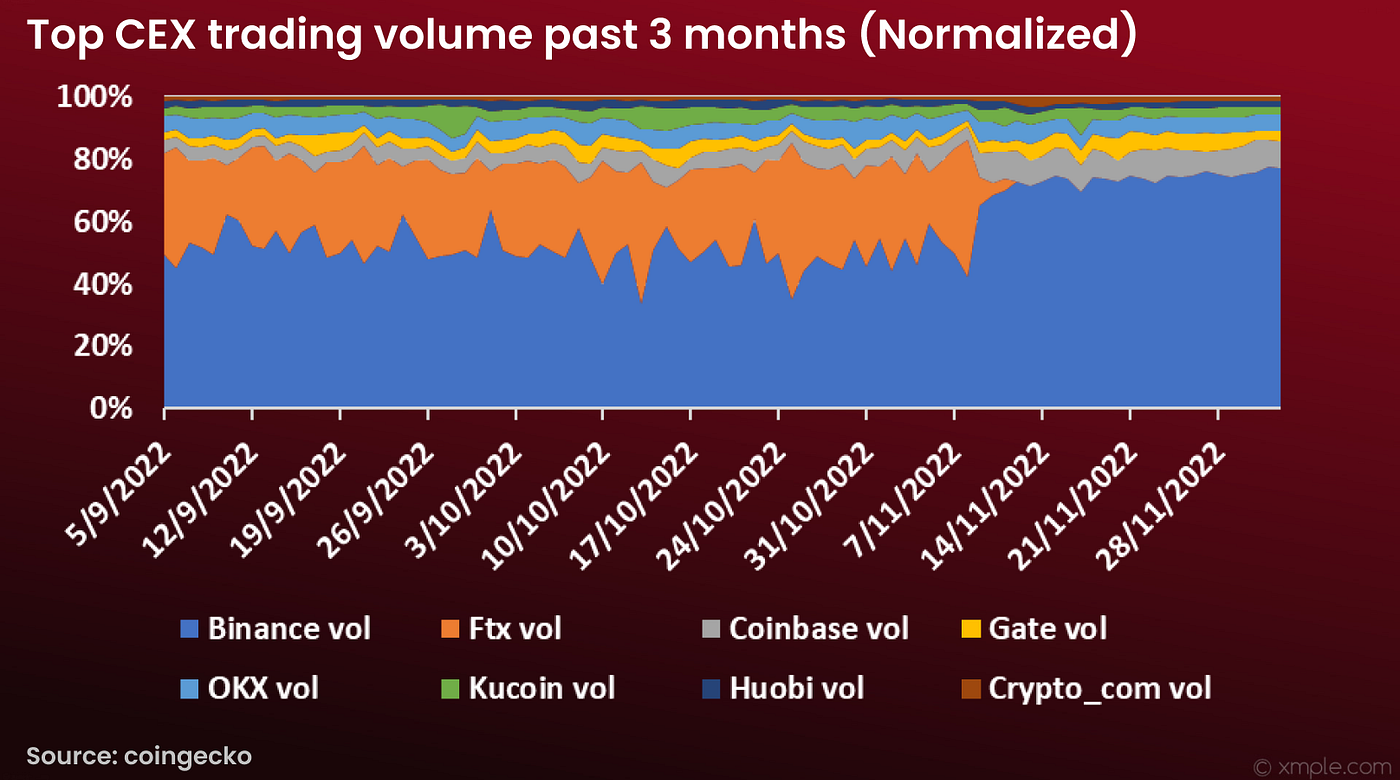
Not surprisingly, binance and coinbase become the major market share after FTX is gone. Before the case, Binance has only around 50% of the market share and now went as high as 80%. OKX and Coinbase also grow a few percent in market share while others are remaining.
DEX volume analysis
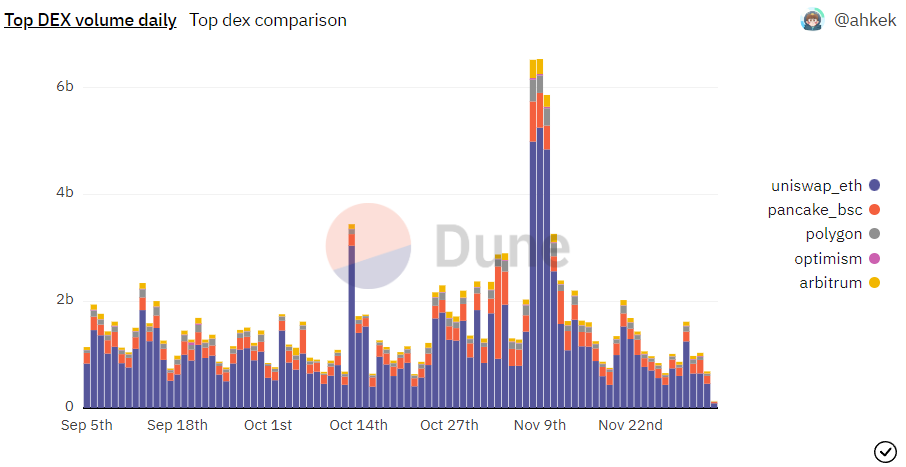
For DEX volume, we are choosing the top DEX from each chain in Ethereum, Polygon, BSC, Optimism, and Arbitrum for analysis. Interestingly, we can see a spike similar to CEX volume which is around 6 Nov as the case of FTX began. Besides that, the volume on DEX is behaving quite commonly without any major changes.

Uniswap from Ethereum chain eating up most of the market share and next followed by Pancakeswap on BSC.
What if we put DEX and CEX volumes together and make a comparison chart?
CEX VS DEX volume analysis
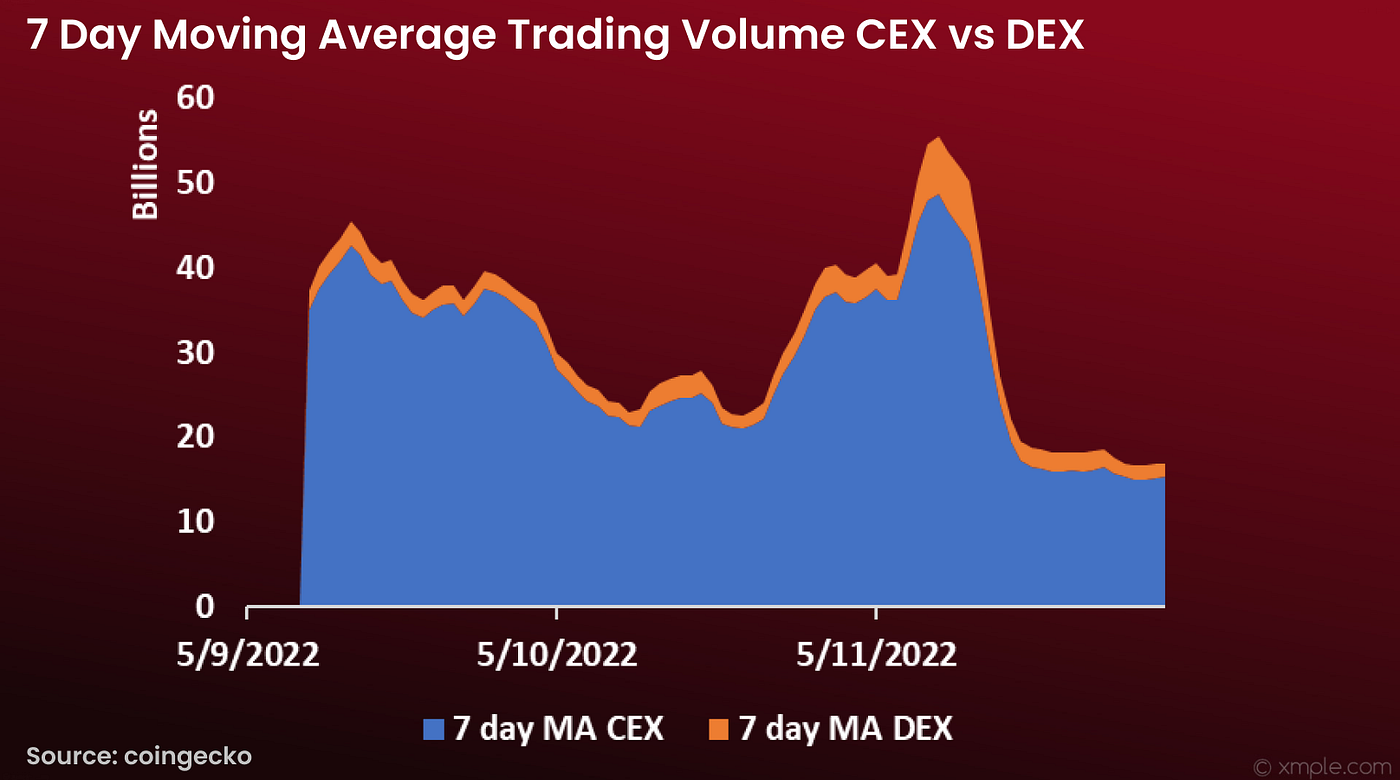
The chart above shows the 7-day moving average trading volume on CEX and DEX. The reason we use moving average is to eliminate the spike and unstable of volume changes and smooth out the chart for better and clearer visualization. After 6 Nov, the total trading volume stays as low as 10+ billion a day. (drop from 30+ billion on average). So after FTX insolvent case, will traders moving over to DEX for trading?

In the of market share, clearly, there is an increase in DEX volume. However, the increase is not significant as only a small percentage increase but now slowly decrease again. Do users still use CEX to exchange?
DEX unique users

The chart here shows the daily unique trader on top DEX. From the chart alone we can see the majority of traders are trading on Pancakeswap. However, there are no significant changes after the FTX case.
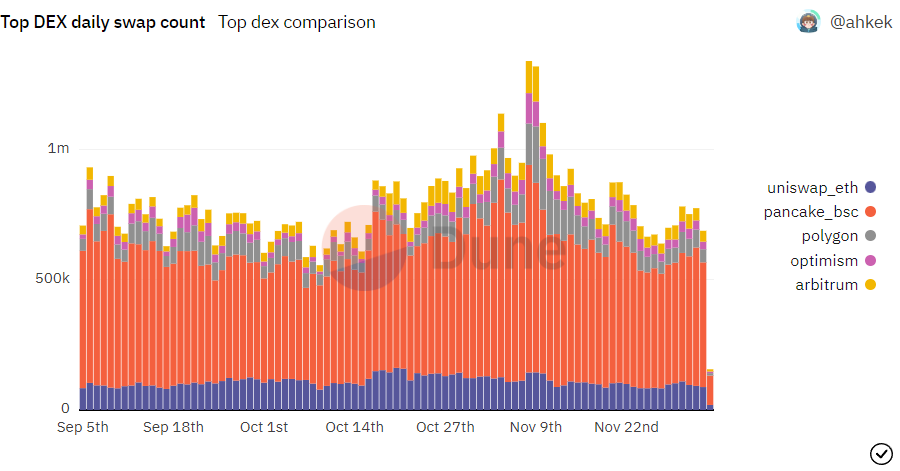
This is similar to the daily swap count on top DEX. No significant changes are to be observed here.
Conclusion to the current DEX vs CEX situation
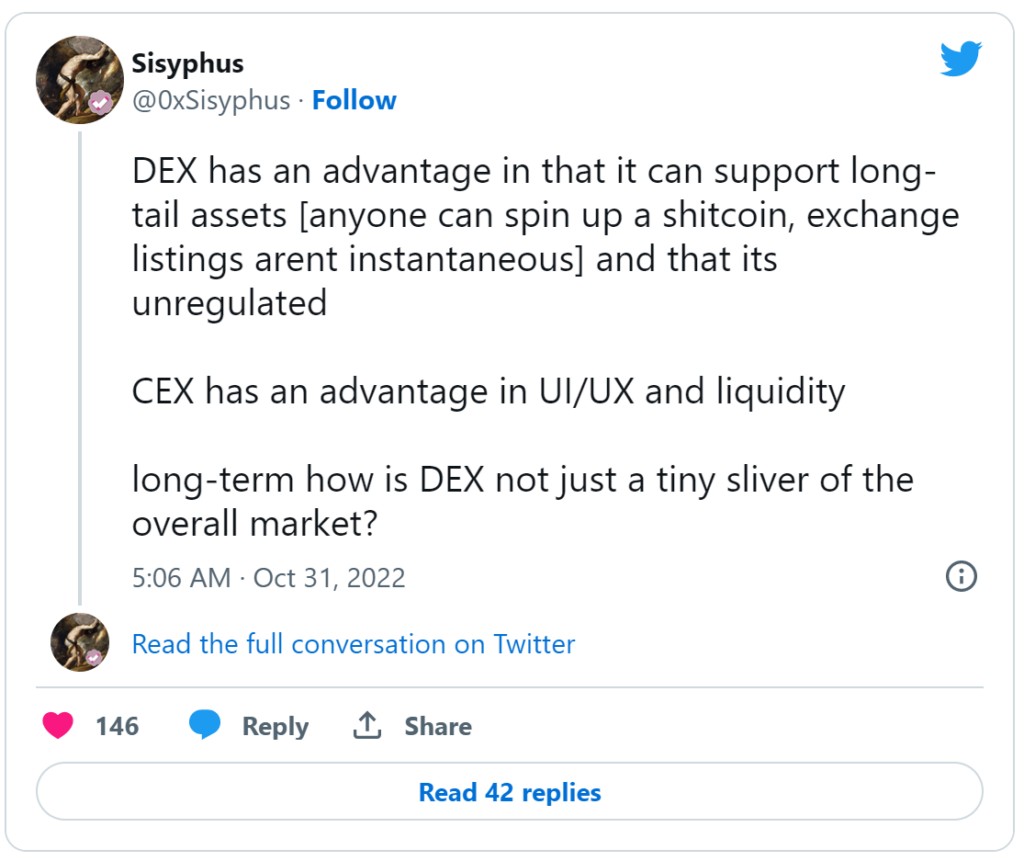
CEX contributes to most of the volume as the majority of crypto traders or holders prioritize using CEX as CEX is more regulated and provides a more easy and convenient UX/UI. The liquidity over CEX is also a lot higher compared to DEX.
DEX will grow with no doubt, but this will take a much longer time for users to switch from centralized to decentralized. For DEX to stand out, they will need to improve the UX/UI and liquidity for a better trading experience.
Key takeaways:
- CEX volume slowing down after FTX vanish
- CEX are dominating the daily trading volume with the majority of the market share eaten up by Binance & coinbase
- DEX growing slowly with Uniswap leading in terms of volume and Pancakeswap leading in terms of the number of unique traders.
- DEX has <10% of trading volume compared to CEX (a lot of room to grow?)