

2. Global Influence
NFT Popularity Reaches A Sustainable Development Phase
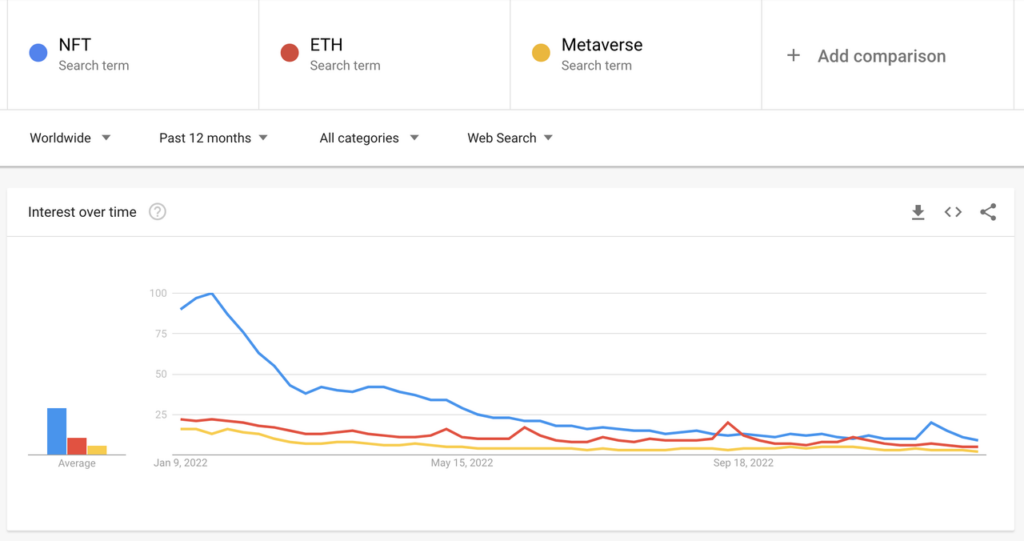
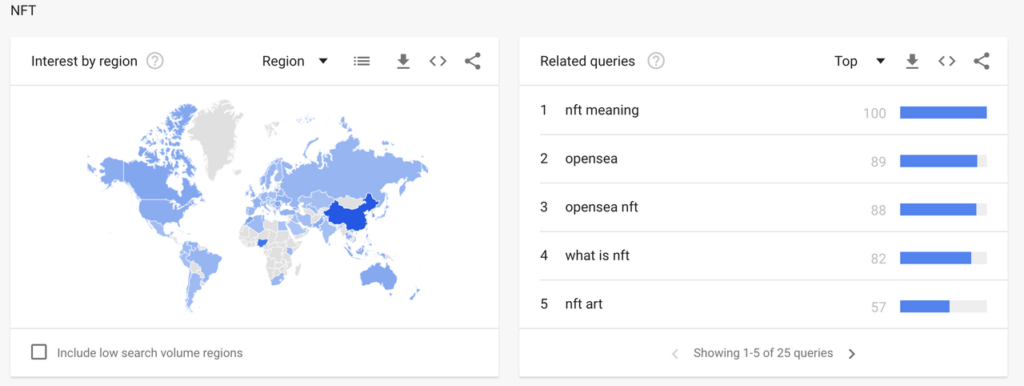
Data source: Google Trends
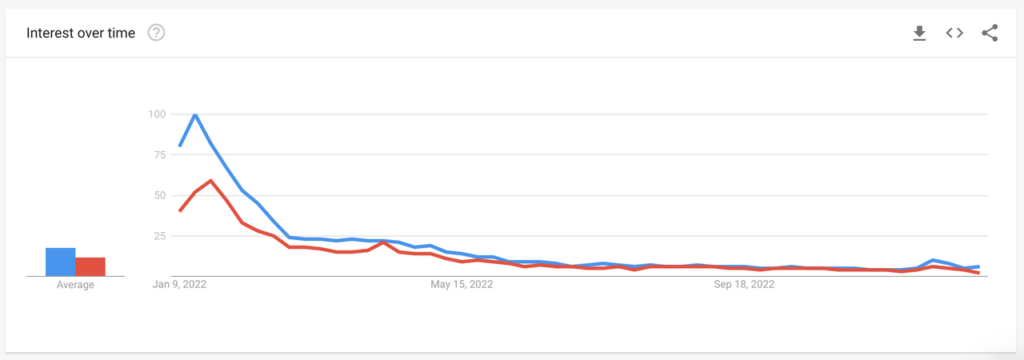
We can glimpse global netizens’ attention to NFTs from Google search volume and can use Google Trends to monitor the keywords “NFT”, “ETH” and “Metaverse.” The trend can be seen in the chart above. Starting from the beginning of 2022, NFT search volume began to increase. The number 100 on the left axis represents the highest point of the relative search volume of keywords on the chart with respect to a given area and time.
In January 2022, there was a significant increase in search volume, which continued to maintain popularity over the next month. However, after booming from the beginning of the year, there was a significant decrease in search volume, with several small peaks during the remaining charted time. The search trends for 2022 are in stark contrast to those for 2021, which was the starting point for the explosive growth in NFTs.
The search popularity for “NFT” is higher than that for “ETH” and “Metaverse.” Searches for the latter two have been relatively stable throughout 2022.
Overall, there’s a hype cycle for NFTs that defines specific periods. From a trend point of view, the popularity of NFTs has reached a sustainable development phase. In other words, there is a baseline level of interest that is unlikely to dissipate anytime soon.
People Are Entering the NFT Field Through the Metaverse
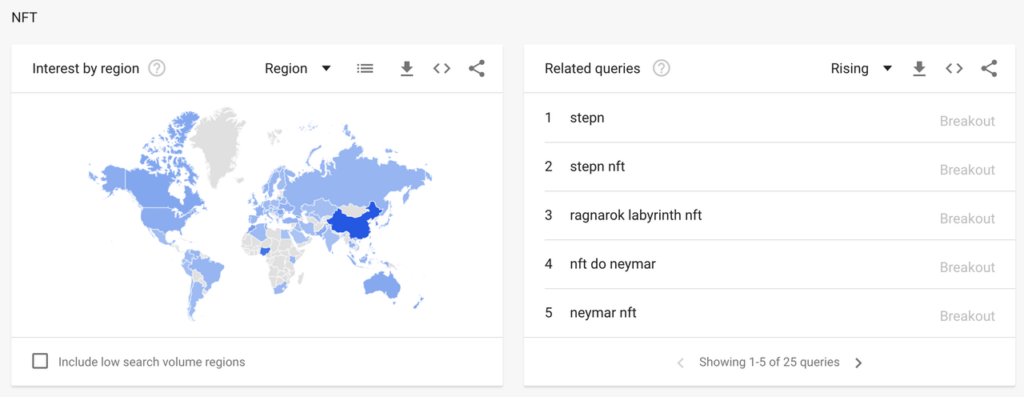
Data source: Google Trends
Analysis of the top 10 related topics and queries related to “NFT,” “ETH” and “Metaverse” shows something interesting. The most related topics, with a significant search rate, are: Stepn, azuki, labyrinth, and neymar. The World Cup and move-to-earn has attracted many newcomers who are willing to participate in the NFT ecosystem.
Data source: Google Trends
Among the topics most relevant to NFT searches, we find that similar to 2021, “NFT meaning,” “what is NFT” and “opensea” continue to rank high. In 2022, we’ve seen the rise of new trading platforms such as Blur, but the influence of OpenSea is still not to be underestimated. Although the overall market is not as hot as it was
at the beginning of 2022, there is still a steady stream of NFT beginners learning what NFTs are and their usefulness in the bear market.
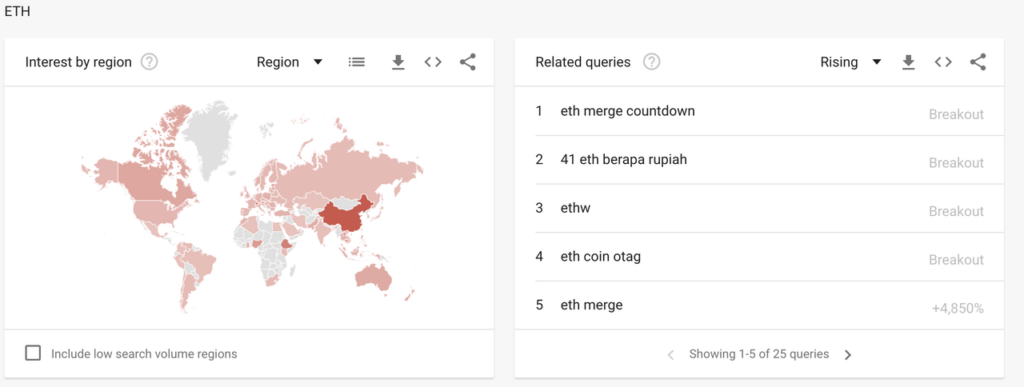
Data source: Google Trends
Looking back across 2022, the search volume for “Ethereum merge” was extremely high – in fact it was one of the hottest crypto topics for the whole year. Around the time of The Merge in particular, the trading behaviour and onchain activities of NFT owners decreased, which is to be expected.
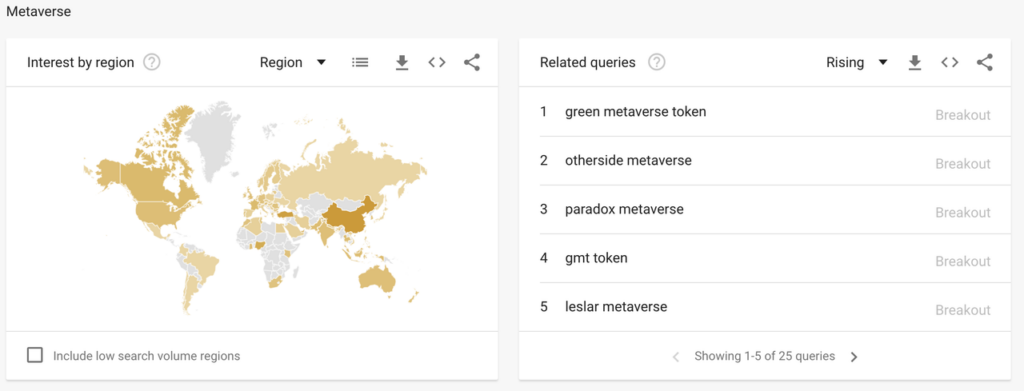
The most interesting related terms searched alongside “metaverse” are “green metaverse token” (GMT), “otherside,” “gmt” and “paradox.” It is worth mentioning that StepN was the star project of 2022, GMT is its token, and three of the top five keywords are related to the project. In addition to this, Otherside issued several news releases in Q2 and Q4 of 2022, and the product’s demo release and its association with other PFPs account for much of this interest.
The Number of Potential Sellers Is Higher than Buyers
From the end of last year to the beginning of this year, the number of people searching for the keyword “buy NFT” reached a historical peak and then went down all the way as the market cooled down. After that, the search indexes of “buy NFT” and “sell NFT” were almost flat, and the latter tended to catch up with the former. From July to November, traders in the market were in a calm wait-and-see period. From December to the present, the market sentiment fluctuated and increased slightly.
NFTs Lay the Foundation for Brand Digital Transformation
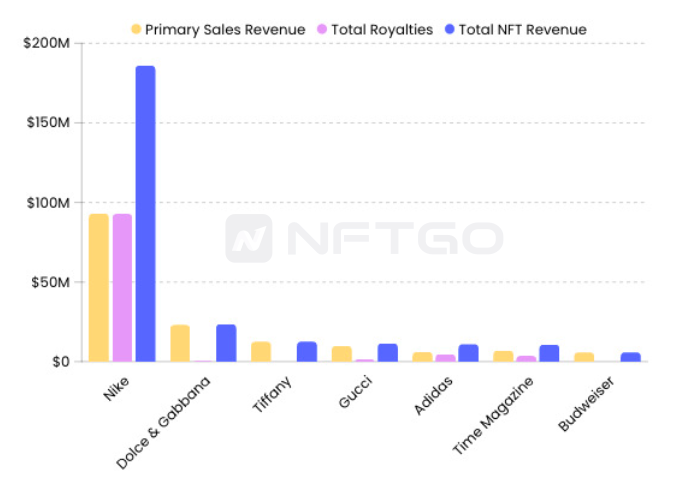
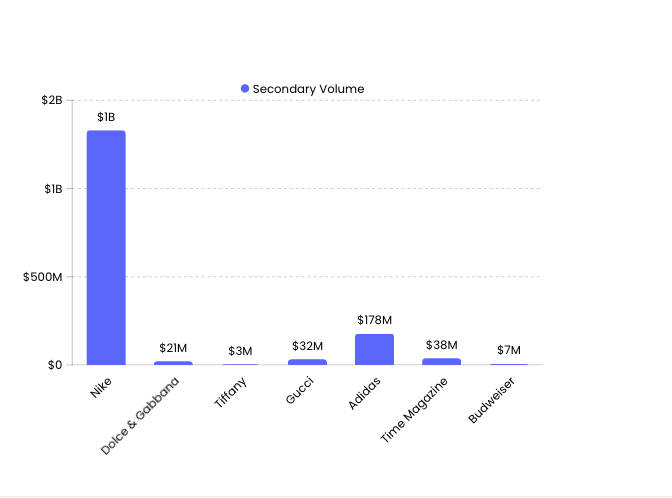
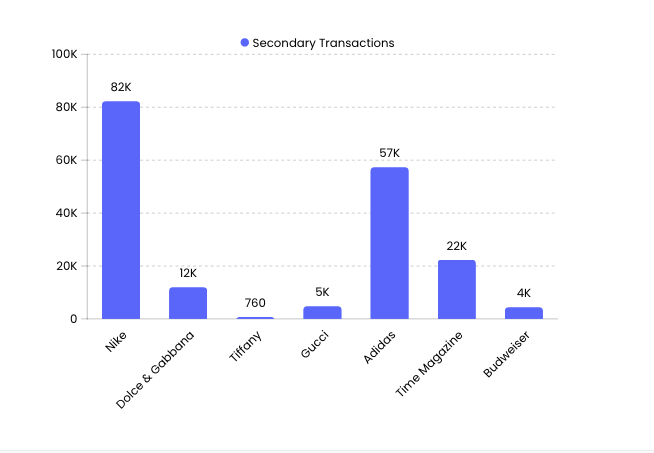
Of all the cases where web2 brands and NFTs have been combined, sports brands have performed the best, especially Nike. After the acquisition of RTFKT Studios, the secondary market trading volume has exceeded $10 billion and generated up to $185 million in revenue, including $93.13 million in primary market revenue and $92.81 million in royalties. Among all the brands offered, the CloneX series ranked first in terms of trading volume, followed by MNLTH, which was airdropped to CloneX holders at the beginning of 2022.
Adidas partnered with Italian luxury fashion house Prada to launch an NFT project built on the Polygon network in January 2022. The project will allow fans to contribute their own designs. Also that month, Lamborghini announced a space-themed NFT collection. In February 2022, the company tweeted about the 360 Lamborghini Aventador NFT collection by the Cars NFT club. In January 2022, Gucci, the global fashion house, announced its entry into the NFT space with the SuperGucci collection, which features ten collaborative pieces created in partnership with toy company Superplastic.
Overall, the entrance of major brands such as Nike and Adidas into the NFT space has had a significant impact on the growth of the market. The presence of these brands has helped to legitimize the NFT space, increasing consumer confidence and encouraging more people to invest in NFTs. Furthermore, the increased publicity has also helped to draw more attention to the technology, furthering its adoption.
How NFTs Are Affected by Digital Asset Regulation
At this point in time, a number of regulators, including the SEC, have not made much progress in rule-making for the crypto market. With multiple 2022 lawsuits set to reach their verdict in 2023, crypto industry regulation should become clearer with the aid of case law.
Before implementing regulation of crypto and even the NFT industry, there are several outstanding issues that need to be resolved urgently by policy-makers. One is whether NFTs are considered securities and whether they can be used as payment for goods and services or for investment purposes. The second is whether NFTs are virtual financial assets and whether they are in the same category as virtual tokens and so on. If NFTs are classified as securities, it remains to be seen whether the SEC will attempt to restrict them, and if so, how.
According to the Howey Test, NFTs should belong to a financial class of assets and should therefore be included in the scope of regulation. With the diversification of NFT distribution, including the maturation of generative art and Generative AI, the definition of what constitutes an NFT has broadened. To some extent, NFTs are no longer limited to digital collections or just JPEG images, but represent a consensus of value based on their community.
The regulatory focus should be on the transparency and trustworthiness of assets, and rating guidelines for assets should be issued. Some NFTs are highly decentralized projects, and users need to pay attention to on chain data and code reviews to educate themselves. Some of the existing centralized projects in the market should also be regulated with appropriate guidelines to prevent market manipulation and other unscrupulous behaviors.
In general, we need to strike a balance between regulation and liberalization. At present, the market value of NFTs is only one-thousandth that of traditional crypto assets, and the sector is still in an embryonic period of rapid development. During this phase, governments will continue to maintain a wait-and-see and attitude.
Market Overview
BAYC Trading Volume Dominates In the Bear Market
The past year in the NFT market has been an incredibly volatile one. The Blue Chip Index, which tracks blue chip collections by market capitalization, has seen extreme highs and lows throughout the year. From January to April, the index was at its highest level, reaching a peak of over 14,600 in January and 14,800 in April. However, the NFT market then experienced a sharp drop in the following months, bottoming out at a low of 900.
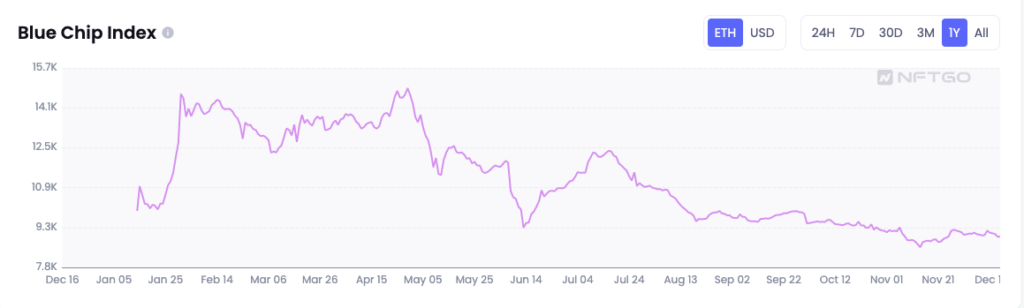
The Blue Chip Index reflects the most valuable NFT assets. While some blue chip NFTs are more resilient than others, the downward trend is still prevalent. According to a report from NFTGo in June, holders were prepared to accept losses ranging from 27% to 46% in order to sell their blue chip NFTs. On average, blue chip NFT holders would lose 40% more selling in June than in April. When examining all of the blue chip projects, we find that BAYC dominates the NFT trading list with the largest share.
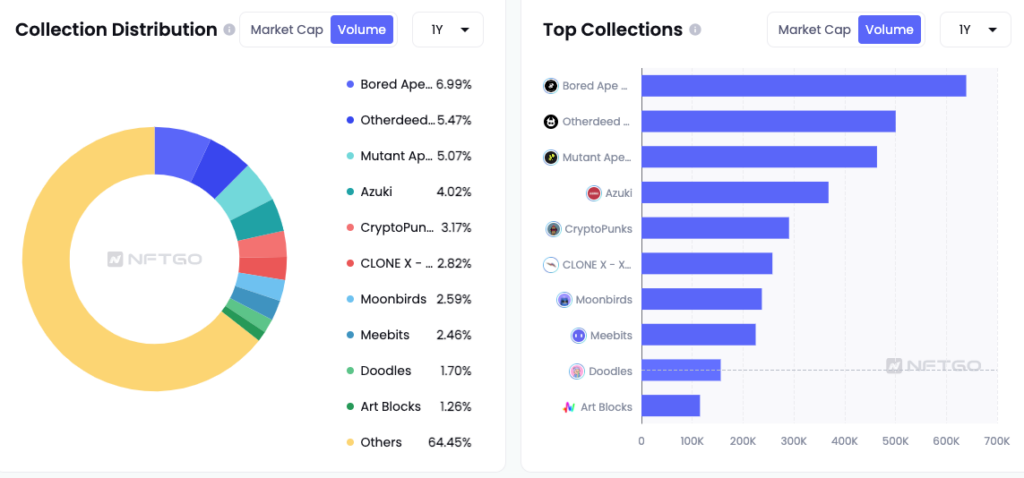
In terms of the trading volume of the NFT market, blue chip NFTs have always held a significant advantage. Looking at the comparison of total trading volume of NFT collections in the past year, the blue chip project BAYC topped the list with a trading size of 639K ETH, occupying 7% of the total. Close to it are Otherdeeds and MAYC, both belonging to the Yuga Labs ecosystem, accounting for 5.47% and 5.07% of trading volume respectively.
The Impact of Top Projects Is Evident
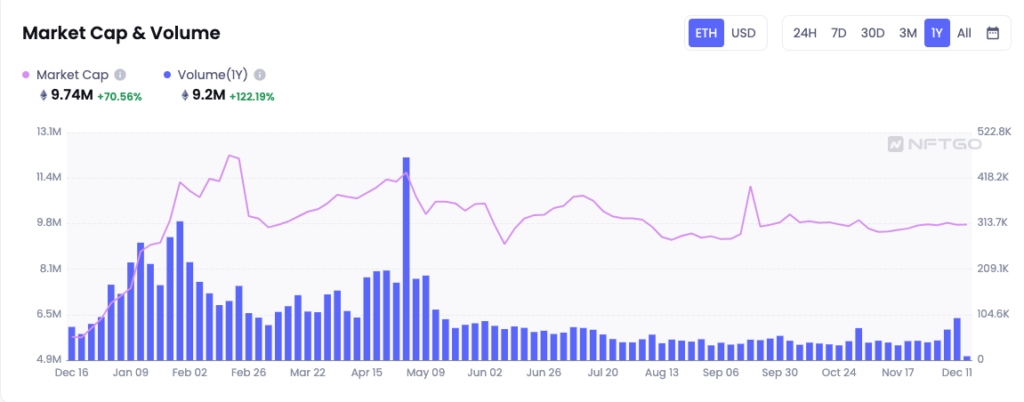
In the past year, the NFT market saw trading volume decrease from its January 2022 high, hitting a historical daily price low of about 31,800 ETH. However the annual NFT trading volume for 2022 amounted to about 9.2 million ETH, up 122.19% from the previous year. It is worth noting that the peak of the annual trading volume was on April 30, the day before the launch of Otherside. The recorded amount was 440,000 ETH, which accounted for 4% of the annual trading volume. Unfortunately, several events following this — including Fed rate hikes, the flash crash of LUNA, and the collapse of Celsius — led to a cold wave in the NFT market and a plunge in the trading volume of NFT assets.

In the second half of 2022, the market went through a transitionary period where transaction levels were low despite the occasional brisk period. In December, the NFT market rebounded to some extent due to positive news from top NFT projects. Let’s not forget that in late 2021 to early 2022, the NFT market experienced an unprecedented bull market cycle, so 2022’s slowdown is understandable. We believe the NFT space is still in its early days and its potential to return to all-time highs — or even to exceed them — remains high.
From Buyers’ Market to Sellers’ Market
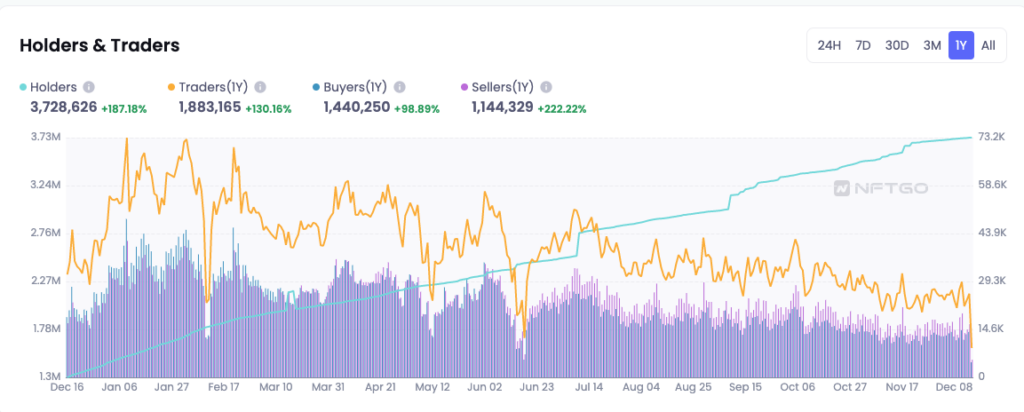
Changes in the number of buyers and sellers is a reflection of trends in the NFT ecosystem. In the first half of 2022, buyers significantly outnumbered sellers. As a result, market demand was high. Buyer power contributed to a hot market that encouraged minting and trading. At that time, the majority of traders were looking to invest in the NFT ecosystem rather than liquidating their assets.
On the contrary, the trend we observed in the second half of the year was drastically different: traders were rushing to sell their NFTs. In addition, the number of traders also dropped significantly. According to NFTGo.io, as of December 15, 2022, there were only 25,563 addresses with trading activities, of which 13,863 were buyers and 16,876 were sellers. Fortunately, the number of NFT holders grew 187.18% over the year and now amounts to 3.73 million holders.

Furthermore, in mid-June 2022, there was a precipitous drop in the number of traders and dealers. Using the daily number of sellers/buyers to construct an index, we can see this index was above 1 until March 2022, indicating that the market as a whole was experiencing a stage of strong buyer power, followed by fluctuation around 1 between March and early May. With late May as the inflection point, seller power began to increase rapidly, after which the index continued above 1, and NFTs entered a sellers’ market. Since then, the NFT industry has entered a deep bear market, and the macro market continued to fall, causing holders to wait and gauge the market attitude and trend. It is worth noting that since around December 5, 2022, the index has trended lower and continued until the end of the year, suggesting that the market is probably picking up.
Specialized Marketplaces Stand Out as the Market Gets More Niche
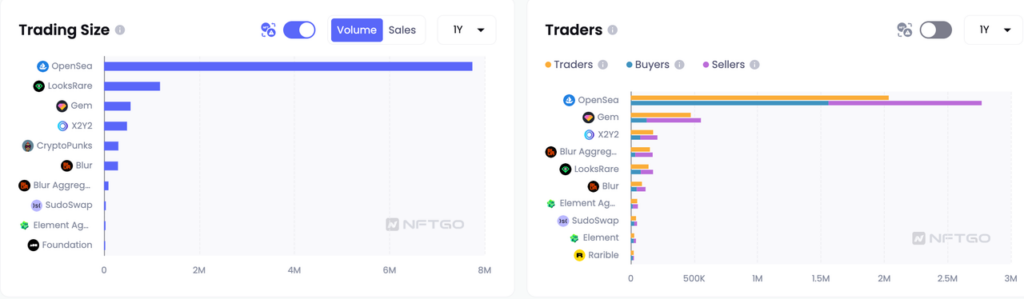
A comparison of the total annual trading volume of major marketplaces shows that OpenSea still tops the list (wash trades excluded). In 2022, users traded 7.74 million ETH worth of NFT assets on OpenSea — 6 times higher than its closest competitor. It is worth noting that Blur, a new platform that launched in October, hit the 400,000 ETH milestone in total trading volume just three months into business. By December 2022, Blur’s daily trading volume had surpassed OpenSea’s.
Competition among NFT marketplaces is no longer confined to satisfying users’ trading needs only. The current focus is on new market niches, such as mandatory royalties, data watchers, bulk quick buys, aggregated price comparisons, etc. in order to attract different user groups. Airdrops and incentives are also ways marketplaces capture market share.
For example, X2Y2, Blur, and LooksRare attract users through airdrops or fee-free models that incentivize them to make orders and trade. However, this model is unlikely to be retained by these marketplaces as it is unsustainable. Furthermore, transactions are driven by demand. Hence, simply stimulating trades is not helpful enough for user stickiness in the long run, especially against the backdrop of oversupply.
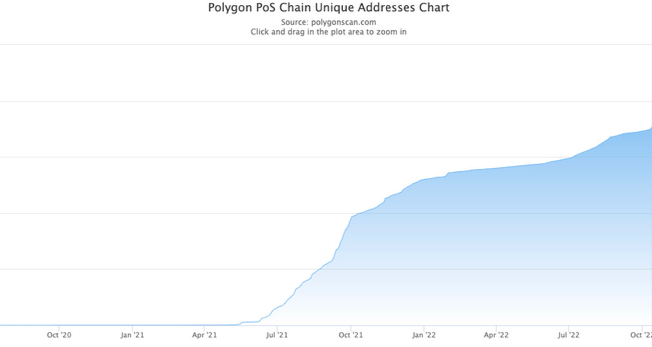
Polygon Sees Tremendous Growth in NFT Buyers
Polygon has opened the door for many web2 users to learn about and buy NFTs through its cooperation with other businesses. In September 2022, Reddit released 80,000 NFTs that users can trade within OpenSea. This was a way for a vast swathe of the web to become acquainted with NFTs and adopt them on a large scale.
In December, the launch of the Trump Collection prompted a number of NFT degens to start buying NFTs on Polygon as well. Before that, some veteran traders were skeptical about the value of NFT assets on Polygon, but the success of the Trump NFTs prompted a rethink. Elsewhere, Magic Eden was one of the marketplaces
that added support for Polygon. As seen in the chart, the number of Polygon NFT traders has doubled over the past year from 700,000 to 1.5 million.
According to PolygonScan, the number of Polygon unique addresses recently crossed the 200 million mark, hitting a record high on December 31. Yet the number of NFT traders on this chain is less than 1% of overall market activity. As the Polygon ecosystem develops and matures, we can anticipate growth in NFT adoption on Polygon. Its transaction speed and low fees are ideal for web2 users who are trying to get started with NFTs. However, Ethereum’s dominant market share is unlikely to be broken in the near future.
FTX Crash Clobbered Solana’s NFT Ecosystem
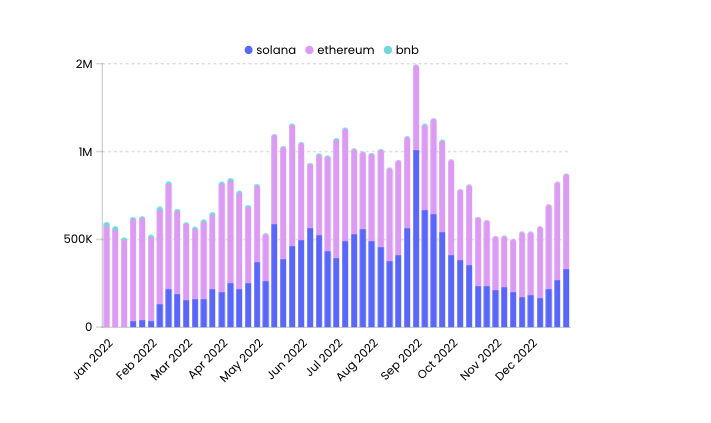
Solana has long been regarded as a promising public blockchain. Its trading vitality kickstarted in 2022 Q2, with Okay Bear leading the volume surge and igniting other projects on the chain as well. In August 2022, Magic Eden even surpassed OpenSea in terms of trading volume. Apart from that, star projects such as DeGods and y00ts successfully pushed Solana NFTs into the blue chip range. Unfortunately, with the arrival of the bear market and the FTX crash, mid-range NFT assets on Solana inevitably suffered a loss of value. However, it is worth mentioning that top projects such as DeGods, ABC, and y00ts withstood the impact and remained at a relatively high position, though their USD prices have dropped almost 40%.
DeGods’ move to Ethereum in 2023 can be viewed as foreshadowing the diversification of Ethereum’s ecosystem. Other public blockchains, including Aptos, are unlikely to outdo Ethereum in becoming the core of the industry.
Wash Trades Occupy 35% of the Total Volume
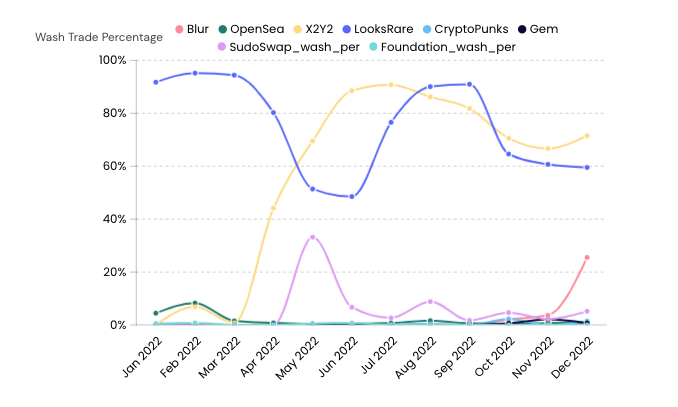
In the previous section, we compared several major trading platforms with the effects of wash trading eliminated. Wash trading is a form of market manipulation where market participants attempt to influence prices through repeated buying and selling, creating the illusion of heavy trading activity. If wash trades are not removed, we would find that LooksRare’s total trading volume in 2022 exceeded OpenSea’s by about 10 million ETH. After analyzing, the total amount of wash trades in 2022 is about 9 million ETH, accounting for about 35% of the total trading volume for the year. Previously in August 2022, NFTGo.io reported that more than 82,000 addresses were involved in wash trading, and the number of wash trades across all blockchains reached more than 250,000.
PFP Is the Key to NFT Mass Adoption
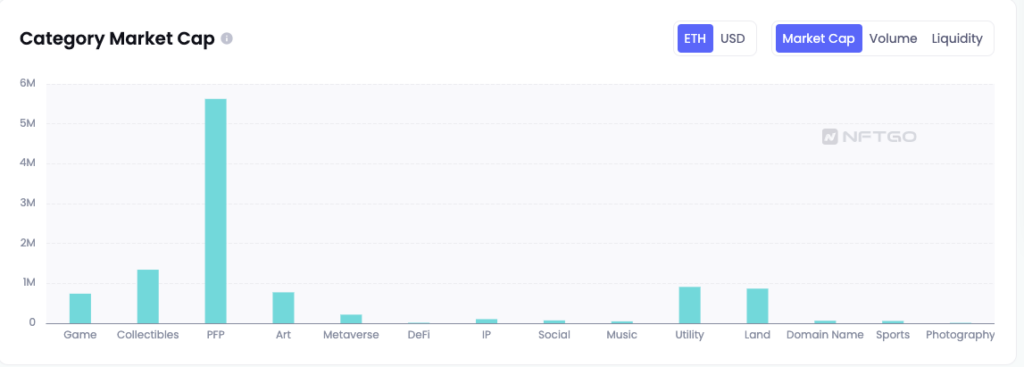
The chart above shows that PFPs remain the linchpin of NFT applications as their total market cap has reached about 5.64 million ETH. On the other hand, NFTs from the collectible and utility categories both saw a turnover of over 1 million ETH, which means that they have good liquidity in the market. In 2023, generative art is anticipated to develop into its own thriving sector following the maturity of OpenAI’s ChatGPT. Furthermore, many metaverse projects are expected to outgrow their conceptual stage and evolve, which will encourage the formation of new NFT applications along the way.
PFPs will remain the foundation and backbone of the NFT industry, on top of which there are various new attempts to offer entrepreneurial opportunities like creating brands with PFP integration, establishing Doodle Gym by Doodle holders, etc.
With the rise of the metaverse, users are placing a greater emphasis on NFT interactivity when purchasing NFTs. 2017 to 2021 is considered the 1.0 era of NFTs where the objective was to test the market’s reaction to the concept of digital asset ownership. Projects that emerged during that period, such as CryptoPunks and Bored Ape Yacht Club, focused on creating unique digital characters stored on the blockchain with an emphasis on uniqueness and immutability. Then, from 2021, we officially entered the NFT 2.0 era where NFTs were no longer confined to the form of images. Other NFT types like GIFs, video, and generative art appeared in the market as project developers experimented with different applications and ecosystems.
Utility NFTs Are the Most Liquid Among All Categories
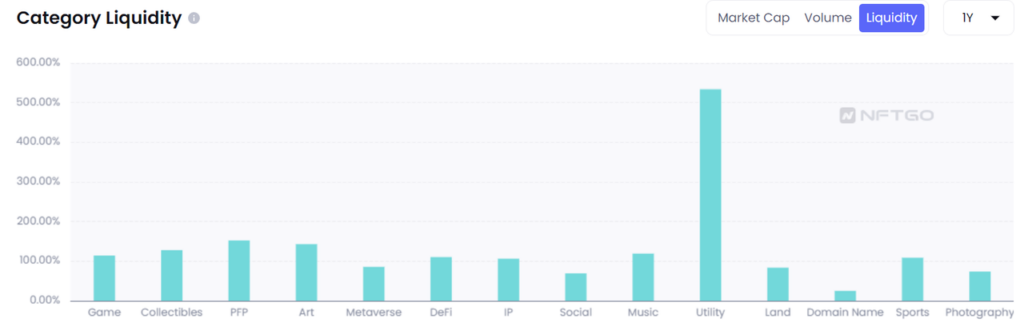
Discounting the effects of wash trading, we found that utility NFTs have the best liquidity of 533.74%, whereas domain name NFTs are the least liquid at 25%.
The NFT Market Remains Unstable
In the first half of 2022, Ether plummeted from its all-time high of $4,000 all the way down to $1,000, and the NFT market was shaken up in response. In addition, as the vast majority of transactions in the NFT market are based in ETH, the downfall also resulted in multiple record lows for NFT prices in USD.
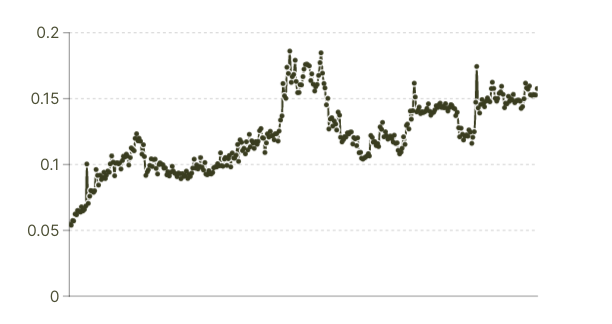
We can quantify the development of mainstream NFTs by looking at the relative size of the NFT market through changes in the NFT/ETH market capitalization ratio. Currently, this ratio stands at about 0.1. At the beginning of 2022, the ratio was about 0.09 — less than 1 — and had been on a volatile upward trend since then. In July, the ratio peaked at 0.2. However, the number gradually fell back to 0.1 as the NFT market shrank and experienced crashes in volume and prices. According to CoinGecko, the current market cap of ETH is about $147 billion, while the market cap of the NFT market stands at about 10 million ETH.
The Correlation Between NFTs and Crypto Deepens
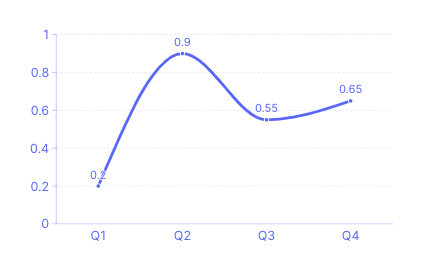
We have analyzed the correlation between the market caps of Ether and the NFT market. In short, the correlation coefficient of the two markets was about 0.8 in 2022, which is relatively correlated. Then in 2022 Q2, the number shot up to a high of 0.98, which was followed by a drop to the 0.4-0.5 range afterwards.
We noticed that on the one hand the NFT market continues to follow the overall trend of the crypto market and is closely related to the general economy. On the other hand, we cannot deny that the NFT market also has trends and performances separated from other markets thanks to its non-fungible nature. To illustrate this further, when the crypto market fell over 20% in June, the floor prices of various NFT categories also plummeted around 15%. However, most blue chip NFTs saw their floor prices recover the week after and some institutions were continuously buying in at low prices.