


Micro Trends in NFTs
NFT Projects Issuance Trends
Steady growth in the number of NFT projects
According to real-time data from NFTGo.io, there are a total of 4,888 qualified collections and 39 million NFTs. Data analysis is conducted for the collection that are listed on NFTGo.io. In 2022, there were around 315 new NFT projects launched every month, meaning 10 new projects every day. The spate of new projects demonstrated steady growth. Despite the market downturn, the number of NFT projects maintained a monthly growth rate of 11.86%.
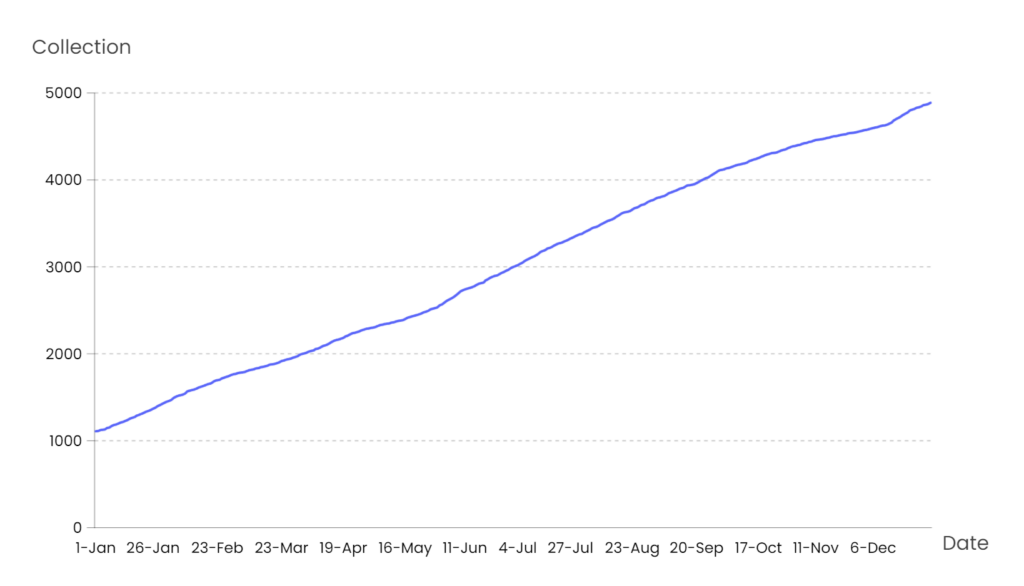
The market downturn has affected the pace of project launches. The number of launches dropped slightly in March, but overall a significant number of NFT projects launched in each month of the year.
NFTs are more regulated
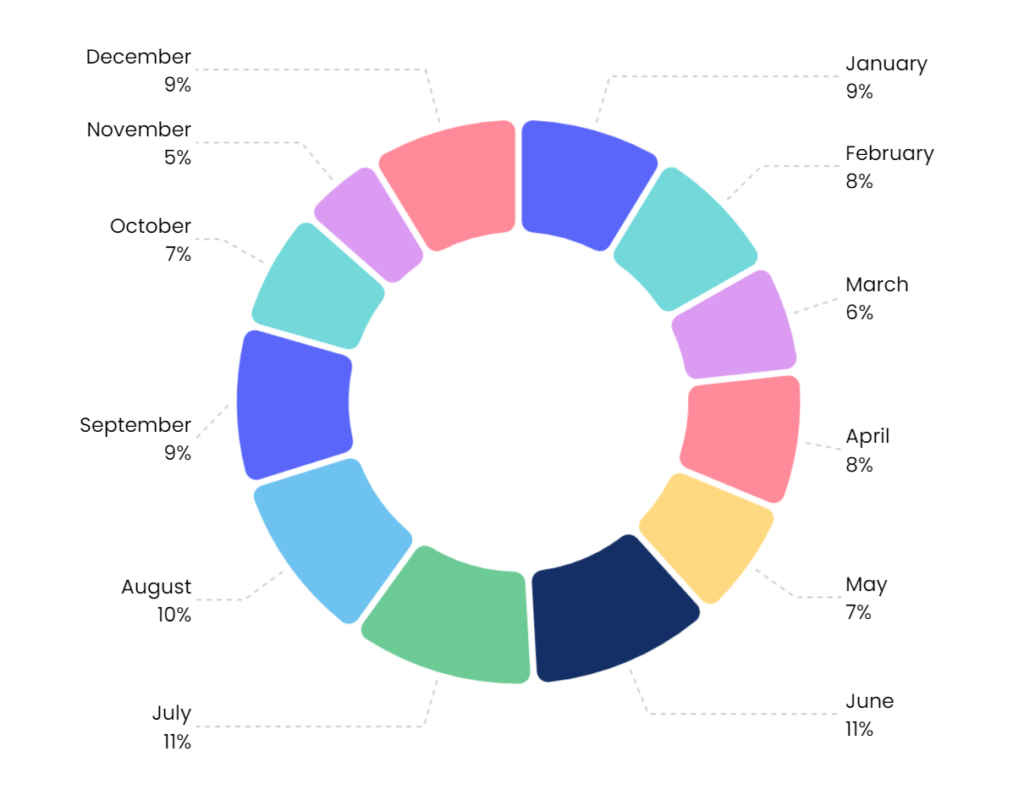
There are new NFT projects launching every month in 2022. In Q4, the launch of new projects has reached its peak.
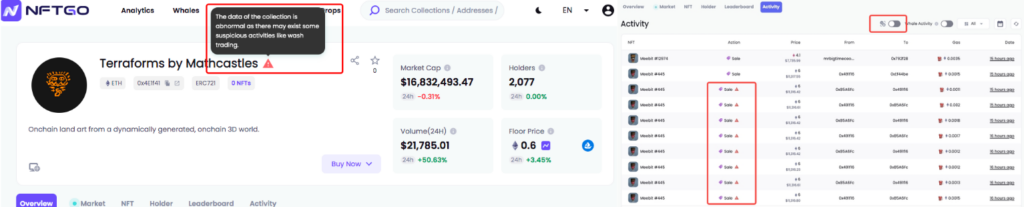
The standardized protocol brings the fast pace of project launch. Furthermore, as the market develops, the projects are also more regularized. For example, NFTGo.io implements a wash trading feature and OpenSea launches a new feature to identify suspicious projects. As more parties are taking steps to regulate the market, making it a safe and secure place, it has encouraged more qualified projects with good design to enter the market.
NFT Projects Market Cap Distribution
The majority of projects are worth around 100 – 200 ETH
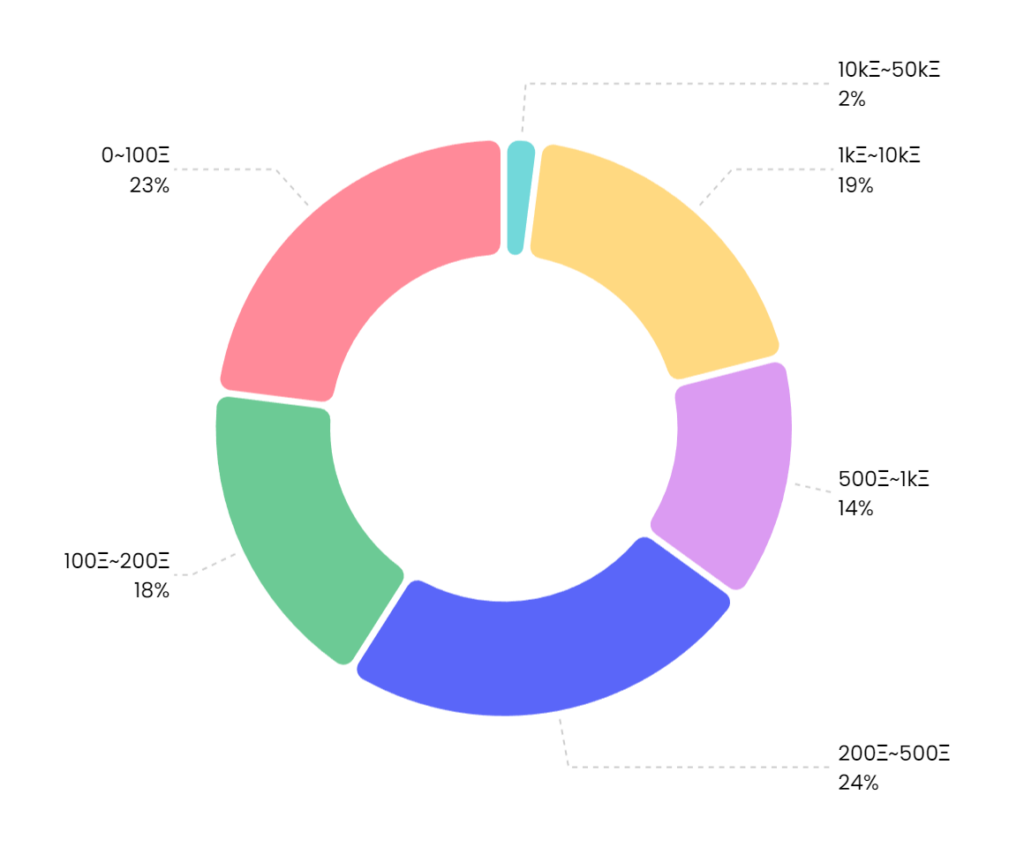
Of all the data we collected, 21% of the projects are worth more than 1,000 ETH while the majority remains between 100 – 500 ETH. The market clearly demonstrates a long-tailed distribution as seen that only 2% of the projects are worth more than 10,000 ETH and they collectively make up most of the total market cap.
Only 4% of the projects have over 10,000 ETH trading volume
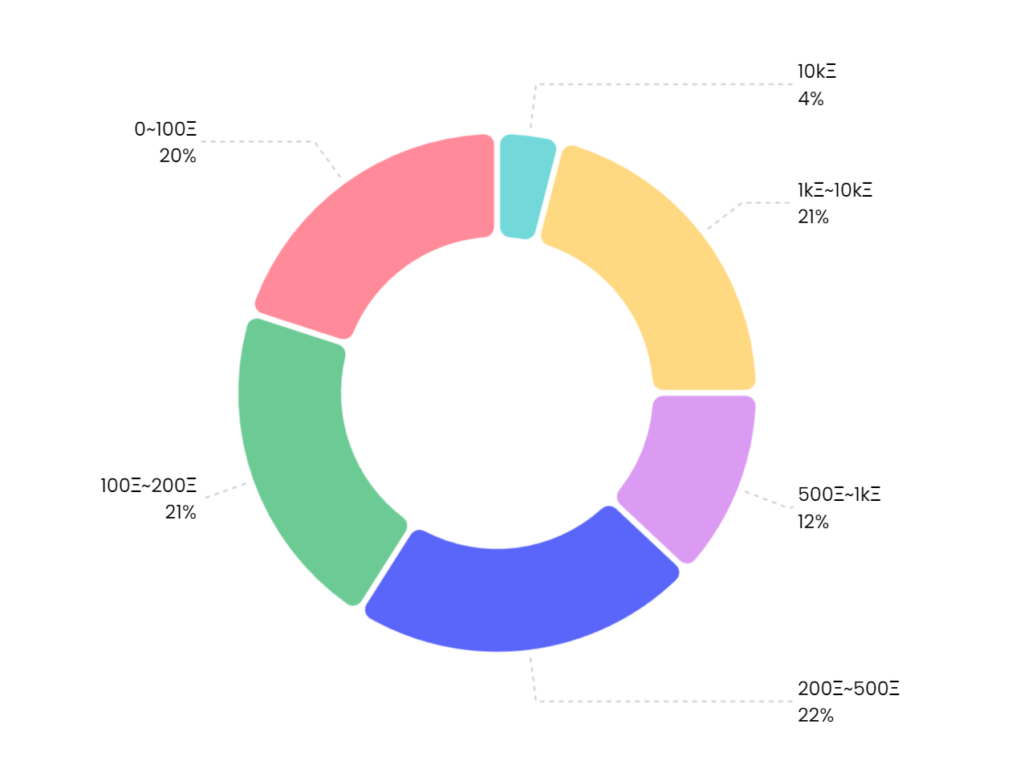
The majority of trading takes place at 100~500 ETH, accounting for about 43%. Only 4% of the projects have over 10,000 ETH of the total trading volume. In the second half of 2022, we observe that projects with trading volume at 20 ETH can easily top the list in OpenSea. In light of recent market conditions, it is difficult for small projects to achieve high trading volume. Most of the trading activities concentrate on high-quality projects.
Floor price ≤ 0.1 ETH takes up 74% of total projects
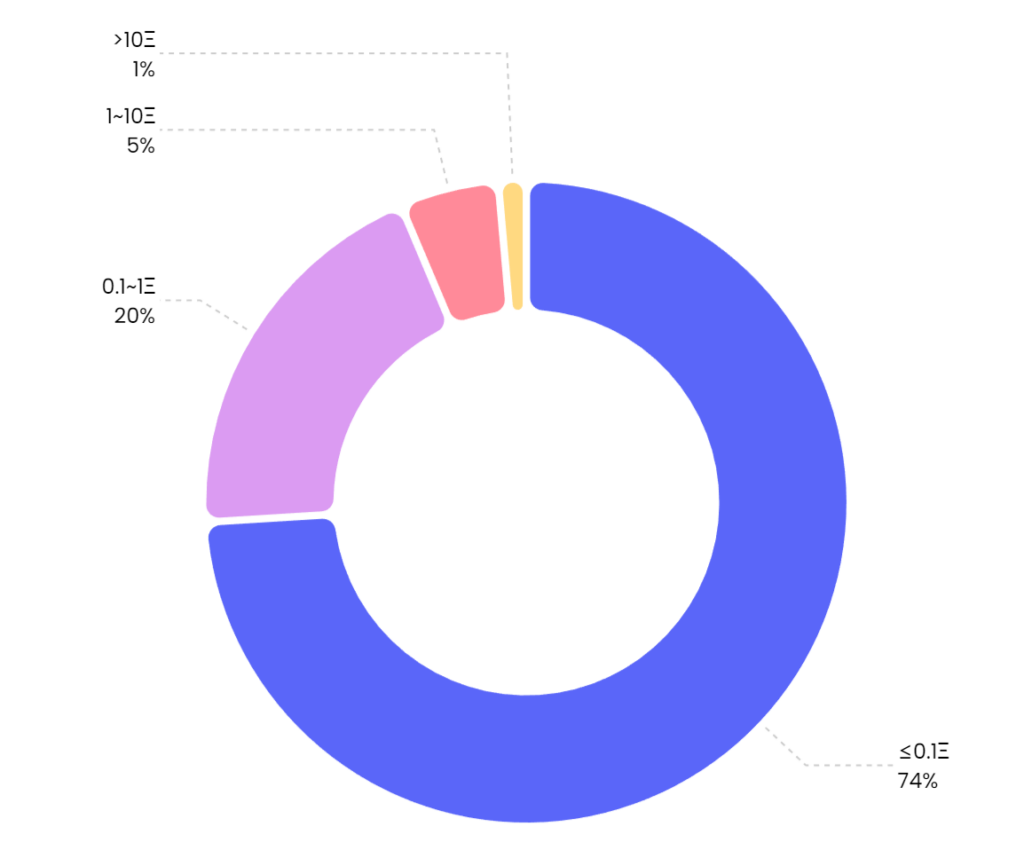
The majority of projects have floor price ≤ 0.1 ETH, accounting for 74%, followed by floor price 0.1~1 ETH (20%), floor price 1~10 ETH (5%). Projects with floor price of more than 10 ETH only take up 1%. The distribution of NFT price demonstrates that “the higher the price, the less the projects”. These few high-value projects make up most of the market cap.
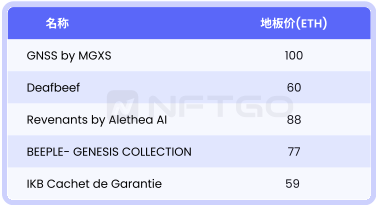
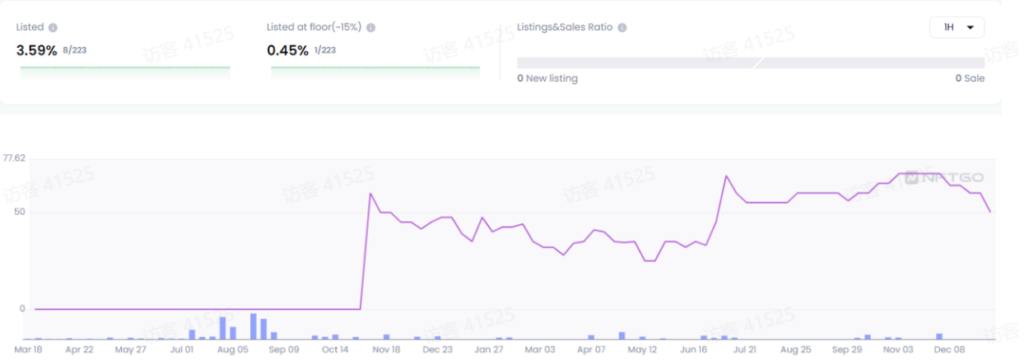
The table above documents NFT projects with trading volume at extremely high prices. These projects all have low NFT listings. This means that a small number of people own the majority of NFTs in these projects. Furthermore, once launched, these projects are traded at a high price. See below example from Deafbeef. It stays at 50 ETH once it is launched, with an order rate only at 3.59%.
Long-tailed distribution at 4 different price ranges
At 0~0.1ETH interval, projects at 0~0.01 ETH take up 47% (1554) and the rest of the prices decline as it moves towards the end. Similarly, at 0.1~1 ETH interval, most projects remain at 0.1~0.2ETH (335) and at 1~10 ETH interval, most projects stay at 1~2 ETH (94).
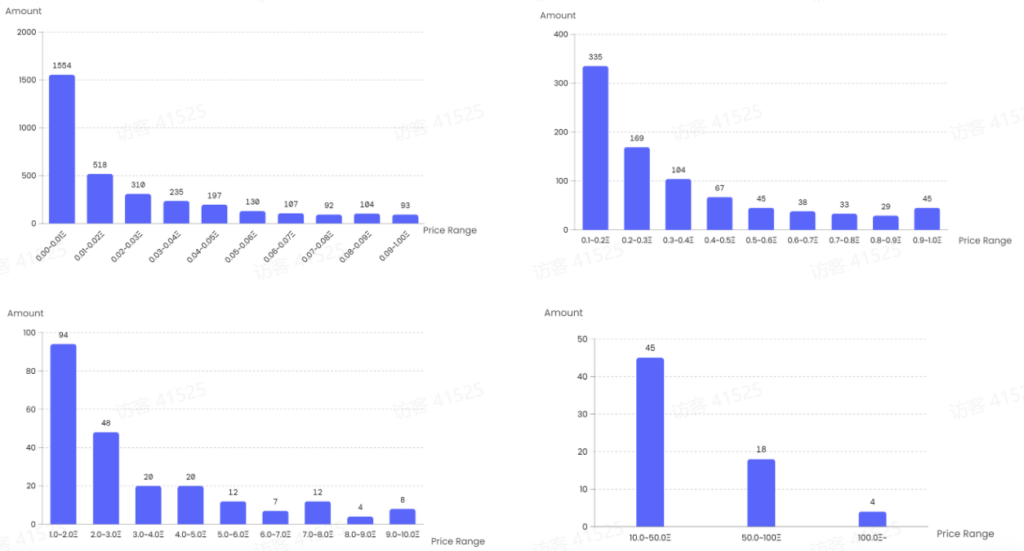
There are many factors that can affect pricing. One factor being the initial price of the project since launch. The initial price of most projects is around 0~0.15 ETH. Second, there is resistance at certain price levels such as 0.1 ETH, 1 ETH, 10 ETH. Some NFT projects hover at certain price levels or even fall to another price level with resistance.
Distribution of Assets In NFT Projects
A huge wealth gap among core users
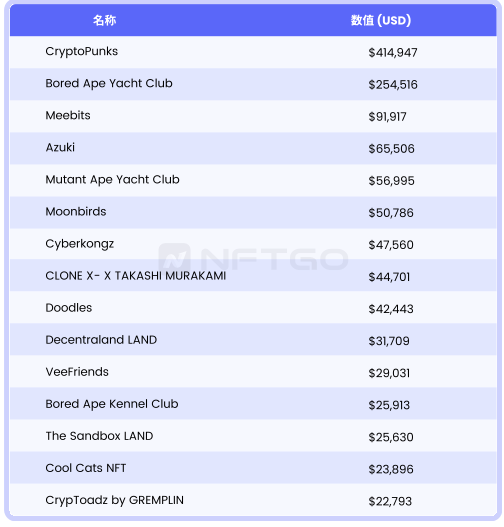
We have selected 748 NFT projects from projects with trading volume above 1,000 ETH and with more than 1,000 partakers. In a single project, the average assets per capita is $4,137 and the median is $1,461. It means the “rich” have lifted the numbers, resulting in a widening wealth gap. Further investigation suggests the gap between the first few top users is drastic. For example, CryptoPunks who ranked first has assets per capita of $410K. Bored Ape Yacht Club in second place has $250K and Meebits in third place has $90K. The huge wealth gap allows the developers of NFT projects to design products that fit the needs of different users based on their purchasing power.
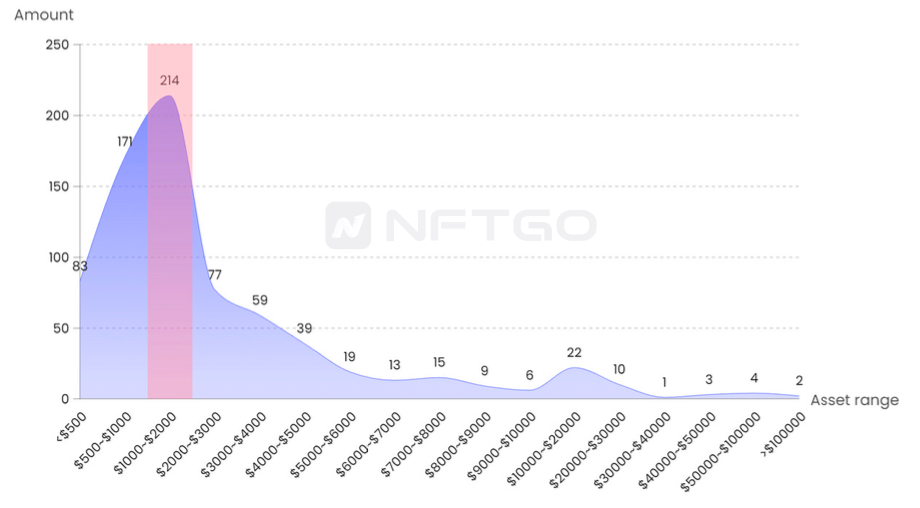
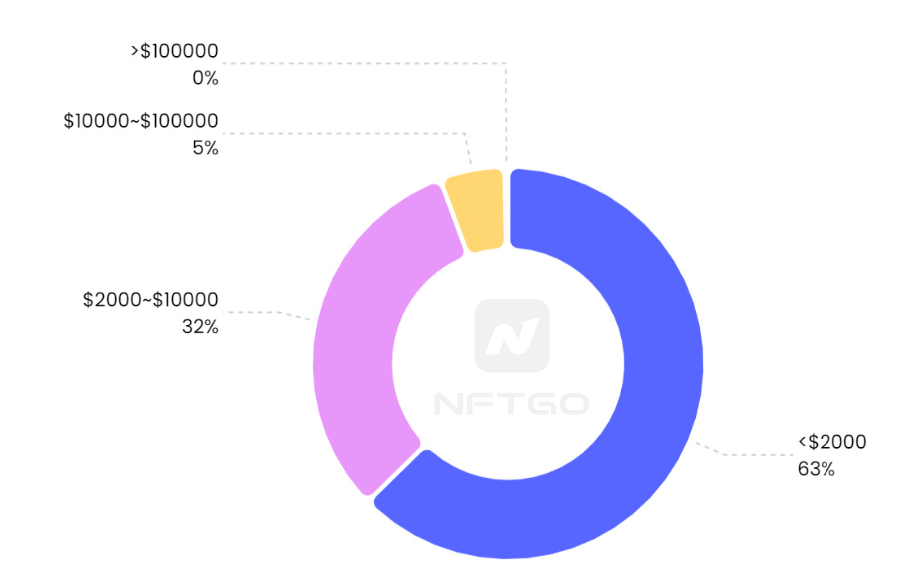
Assets Distribution of Users
Within the 748 eligible NFT projects, the majority fall below $2,000. Users with assets per capital from $500~$2,000 account for 52%. These users are usually the core users of the 385 major NFT projects. Another peak is observed at $20,000 assets per capita. These projects include Cool Cats NFT and Otherdeed for Otherside, which are rather popular and well-known.
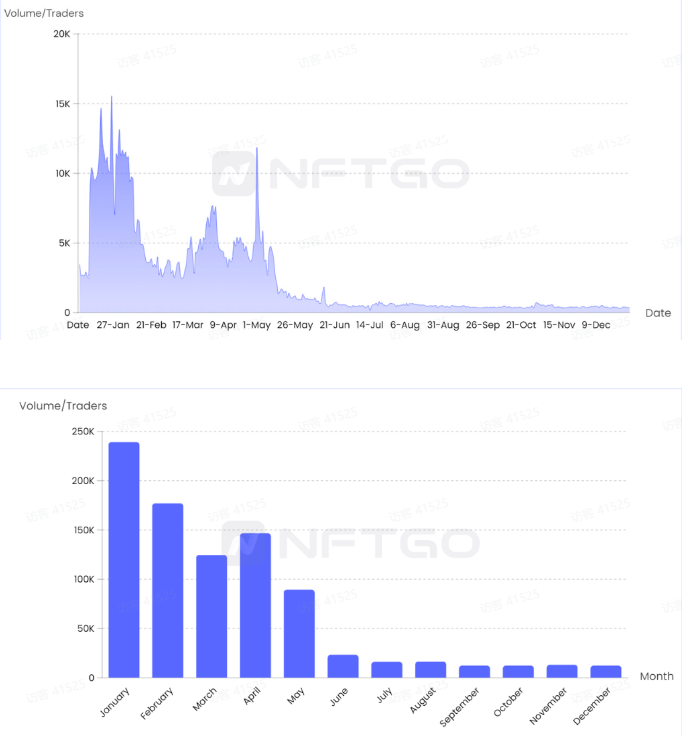
Analysis on NFT Liquidity
NFT liquidity refers to the ability to sell NFT smoothly at a reasonable price. When there is a lack of liquidity, some NFTs must be discounted in order to be sold quickly. NFT liquidity is closely related to the market. Trading volume and traders’ activities are used to measure the liquidity trends. We can conclude that the market is the most liquid in January and April. It becomes less liquid in May and gets to the lowest point in September.
The liquidity of different projects is fairly different. In general, NFT projects which top the list remain a certain degree of liquidity and are usually less volatile, while projects with lower rankings tend to be less liquid over time and are more likely to be volatile.
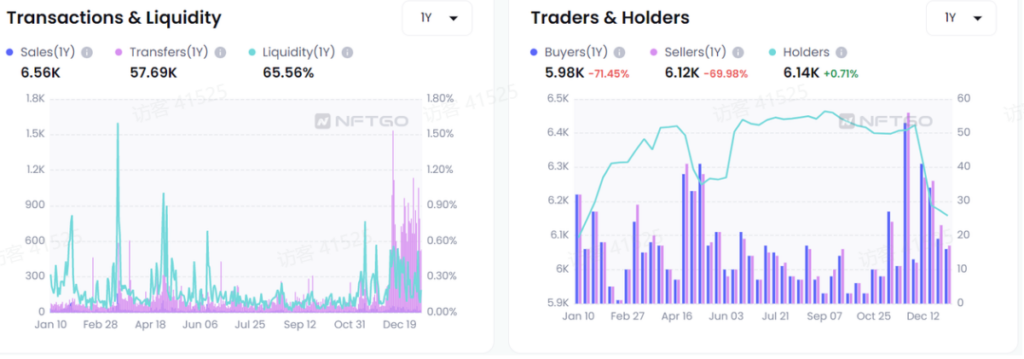
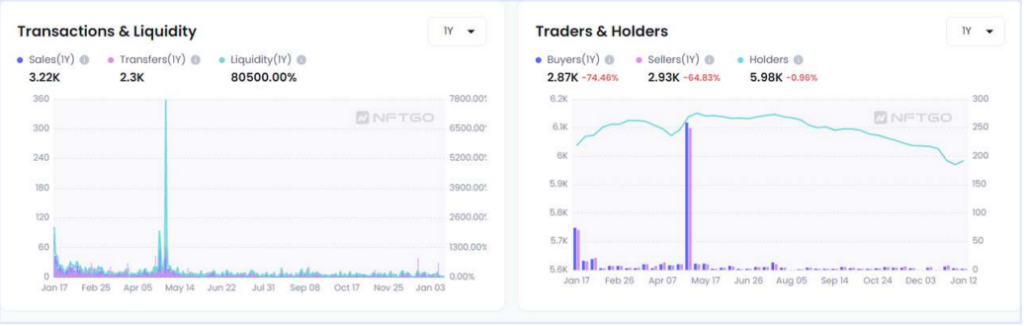
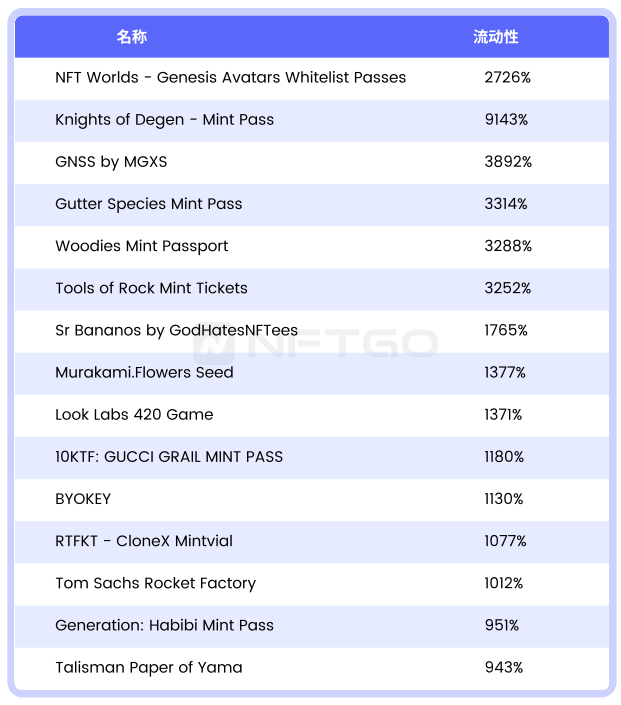
The list below captures the top 15 NFT projects with highest liquidity. They are usually Mint Pass. Interestingly, NFTs that are more fungible tend to be more liquid.
Are Blue Chip NFTs More Resilient?
The market response is more “sluggish”
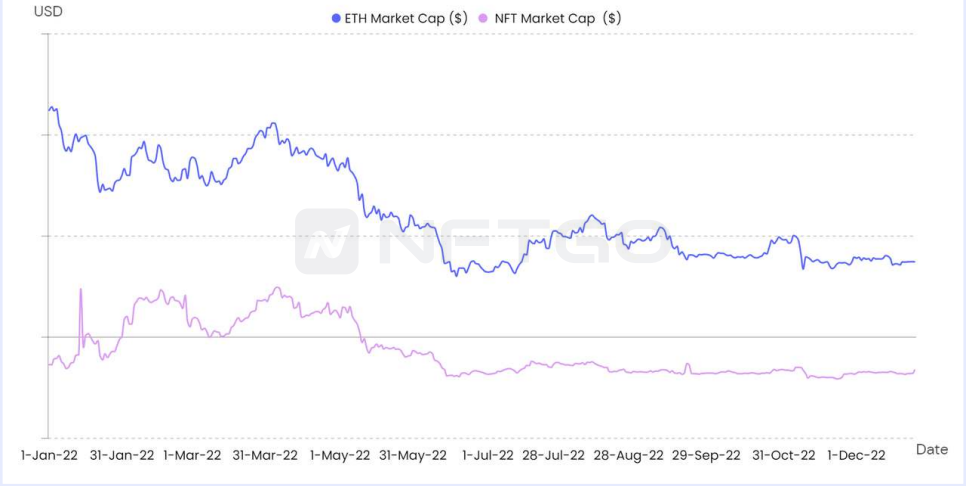
The NFT market is closely related to the crypto market. It is thus natural that the former will be affected by the latter. However, it is observed that the NFT market response is usually more “sluggish”. As seen below, when the market value of ETH declined, the value of the NFT market did not drop simultaneously.
Does being “sluggish” make NFT a safe haven asset?
Based on our observations of NFTs, we found that some interesting facts. To begin with, there is a lack of liquidity in NFT. When the market fluctuates, it takes a long waiting time to complete the transactions. Second, when the market fluctuates, there will be network congestion. The transaction fee of NFTs will be extremely high, making people less willing to buy or sell. This results in a drop in trading volume while maintaining a rather stable floor price. Third, when there is a market downturn, users with digital assets may switch their assets to NFT to avoid risks. This in turn stimulates the NFT market. There can be situations where the price of the NFT and crypto market goes in a completely different direction. Therefore, some NFT projects with stable development may be considered as safe haven assets.
How Do Users Make Profits By Bottom-fish?
To buy more in batches as the price drops
Among the top 10 whales who bought Otherdeed within the time frame, the #1 whale bought 55 Otherdeed NFTs with 112.97 ETH ($160K). As of June 21, Otherdeed’s floor price rose to 2.4 ETH, thus making a gain of 17%, or 19.25 ETH, for the whale. Let’s see how he managed to do it with $160K.

(1) From June 7, when Otherdeed’s floor price gradually declined, the whale began to buy 6 from the collection with an average price of 2.596 ETH.
(2) On June 9, Otherdeeds’s floor price fell below 2.5 ETH. The whale again bought another 10 with an average price of 2.368 ETH, thus reducing the cost of his short-term position to 2.45 ETH.
(3) The plunge accelerated on June 12 when the floor price dropped to 1.8 ETH. The whale made his final purchase of 39 Otherdeed NFTs with an average price of 1.89 ETH. At this point, his average cost is 2.05 ETH.
Overall, the whale’s strategy is to gradually increase its position: the greater the decline, the more it buys. Purchase prices are divided into 3 ranges: 2.5-2.7 ETH, 2.3-2.5 ETH, and 1.7-2 ETH, where it bought 6, 10, and 39 respectively, lowering the average price to about 2.05 ETH. Another thing worth noting is that when Otherdeed’s price rebounded from June 13 to 15, the whale continued to buy instead of realizing its gains. This indicates that the whale adheres to its valuation, thus, even if the price remains in the “bottom range,” it will continue to buy.
Cost control ; Bottom-fish by category
Next, let’s have a look at the whale who made the most BAYC purchases during June 7-18 and see how it worked. Starting from the price on June 7, he bought 1 BAYC when it dropped by 10%. Then on June 13, the price dropped by 20%, so he made another purchase. After that, he bought 5 more when the price fell by 20%-30%, thus reducing his costs to 80 ETH. On June 14, the whale bought BAYC in the top 10% rarity with 120 ETH on LooksRare.

The whale buys into BAYC according to the range of price drop. It made purchase for every 10% drop. On top, it also bought NFTs of different rarities by category.
Through the analysis above, we can conclude some underlying rules whales go by when buying at the bottom:
1. For individual NFTs, bought in batches (3 batches) according to ranges, and buy as soon as the price enters your valuation range.
2. Buy according to the margin of the plunge instead of time—the more it drops, the more you buy.
3. Try to make an offer.
4. For main blue chips, go by rarity classification; for new and emerging blue chips, diversify your combinations.
5.Try out multiple platforms including X2Y2 and LooksRare instead of limiting yourself to OpenSea.
How Much Can You Earn From Royalty?
Accumulated royalty income of NFT developers
On 26 August 2022, X2Y2 announced a flexible royalty option to NFT buyers who can voluntarily choose to pay 100%, 50% or 0% of royalty fee when purchasing NFT. The announcement sparked a widespread discussion. Many NFT developers stated that royalty fee is an important support to their creation. As of 30 December, Otherdeed has earned 18,000 ETH from royalty income and based on the conversion rate of ETH on 30 December, it means a revenue of $21.96 million. Below are figures from OpenSea demonstrating royalty income from various projects.

How much money can you make if you launch NFTs in a bull market?
This year, many heated projects spiked up the trading volume to 1,000 ETH as soon as they launched. These projects are seen from January to May. (According to NFTGo.io, there are more than 1,215 NFT projects with trading volume more than 1,000 ETH.)

Assume there are 10,000 NFTs priced at 0.08 ETH, royalty being set at 5% and the total trading volume at 1,000 ETH, the sales revenue is 800 ETH and the royalty income is 50 ETH. Based on the ETH conversion rate at that time, the project total revenue is $1.95 million. Not to mention that royalty will be a continuous source of income.

Analysis on NFT Hype Cycle
Mimicking the concept
The NFT hype is usually led by new concepts which draw interest from the media. Many then start to copy the concepts and the marketing strategy, which eventually triggers a widespread discussion. In January of this year, the PFP set off a craze for blue chip NFTs. It began with the increase in floor price of NFTs such as CryptoPunks and BAYC, which made people expect a growth in these high value projects. The market was then swept over by FOMO sentiments. As projects such as Azuki, Clone X and Mfer were launched, the trading volume of the market reached its peak. In addition, the success of Goblintown.wtf made “Free Mint” became the major way to launch projects in May and June.

The “mimicking hype” flooded the NFT market with a variety of projects and yet, many share similar designs.

Rotation of Categories in NFT
It is observed that NFTs have slowly transformed from something high value, seemingly unachievable to something that is more down-to-earth and has actual utility. Concepts that are new and innovative tend to get hyped. Rotation of categories in NFT is observed:

These new concepts will trigger the rotation and naturally the NFT projects will rank higher. When a new concept is introduced to a project, for example, when “Game” is introduced to Bored Ape Yacht Club, the market price of the project will increase for a while. Other projects will follow and imitate, which leads to an increase in market value in turn for the top few projects.

Top Sales
Most Valuable NFT in 2022
There were a large number of NFTs that sold for high prices this year, with the top 100 highest prices all sold this year, and they all sold for 250 ETH or more. The highest price this year was set by CryptoPunk #5822 in February, which sold for 8K ETH.

Top #20 Sales in Summary

Top #10 Sales in Each Category

Games

PFP

Art

Land

DiFi

IP

Domain Name

Social

Music

Top #10 Most Profitable Address

Top #10 Whales

Top #10 Marketplaces

