


A huge amount of NFT trading volume on Ethereum is a mirage – read on to find out why, and what we can do about it……
by hildobby
When it comes to crypto data, things aren’t always as they seem.
Behind the big, shiny metrics – there’s often more to the story.
In this article we’re going to examine the phenomenon of wash trading in NFT markets, and how it distorts critical metrics.
We’ll explain what it is, how it works, and how to properly measure it in your Dune analyses.
We’ll learn how wash trading impacts different major marketplaces, and the shockingly large % of total NFT trade volume it comprises.
Finally, we’ll wrap up with some thoughts about its future.
What is wash trading?
Wash trading has long been known in traditional markets as a malign form of market manipulation where investors create fictitious transactions designed to look like legitimate trades.
The motivation is typically to mislead the wider market to the wash trader’s advantage.
It’s nothing new. Back in 1936 the Commodity Exchange Act (CEA) was enacted in the USA. It provided federal regulation of all commodities and futures trading, and also officially made wash trading illegal.
Fast forward to today – and cryptocurrencies and NFTs still sit outside of the remit of the CEA, although it is speculated that the wash trading of NFTs will inevitably get regulated at some point.
We’ve seen plenty of wash trading of fungible crypto assets on CEXes over the years. For example in March 2019, Bitwise shared a presentation with the SEC. It explained that out of the $6B in $BTC spot trading volume reported on CoinMarketCap ~95% was fake.
You could argue that this is old news, however, an article published in July 2022 by Kaiko says otherwise. It explains that Binance’s volume exploded on a few trading pairs once trading fees were removed, a behavior that is a dead giveaway for wash trading.
NFT wash trading
So the wash trading problem is nothing new to crypto. Throughout 2022 though, it has become particularly pertinent to the world of NFTs.
How widespread is wash trading in the NFT world? Well, I found that at its height in January 2022 – more than 80% of volume was wash trading.
With a total of 58% for the entire year, it hasn’t exactly gone away.
NFT Wash Trading Explained
The NFT market saw tremendous evolution and growth over the past few years.
In 2022, the NFT marketplace sector in particular became increasingly hyper-competitive, with new platforms launching constantly.
To cut through all this noise, many have relied on the trading volume of a platform as a key metric to evaluate its health and traction, and as a simple proxy to compare the usage of different marketplaces.
In this environment, how is a new NFT marketplace to gain attention & market share? How is it to increase the all important trade volume?
One of the earliest innovations in the space was enticing traders with token rewards.
Rarible was one of the first to use their token ($RARI) as a reward for active users, but others soon caught on.
Last January, LooksRare made it central to their strategy with the $LOOKS token and X2Y2 soon followed with their $X2Y2 token.
People quickly realized that gaming these token reward programs had the potential to be a highly profitable trading strategy. Chainalysis reported that some wash traders have done very well indeed, with 110 addresses collectively earning $8.9m in profit.
Profits are by no means guaranteed though – most addresses associated with wash trading lost money due to transaction fees. Collectively though, the profits of the successful wallets significantly exceeded the losses of the unprofitable ones!
So, how does NFT wash trading work?
In a nutshell, the most common method is trading your own NFTs between two wallets you control for the highest amount of ETH possible. The goal is to accrue token rewards with a value in excess of the gas fees you pay.
The boom in wash trading really made life tough for us data analysts, since it skews basic statistics that we use to track marketplace usage.
While only a small percentage of users engage in this practice, those trades often heavily impact total trading volume.
You’ll see how in some of the stats further on in this article.
This all makes trading volume a far less reliable metric. As a result, many analytics platforms make efforts to filter out this inorganic behaviour, but with little transparency on how it’s done.
Why would I rely on a metric if I don’t know how it was put together?
I needed to create an open-sourced method available for all to use.
Filtering wash trades – the hildobby Method
Back in February, a few months after LooksRare launched, I published my LooksRare-specific filtering method with a Twitter thread and a Dune dashboard.
While I still like this method, it had some crucial flaws that I needed to address.
It’s now outdated because it exclusively works for LooksRare, which was great at the time, but the space has grown a lot since.
Now newer marketplaces like X2Y2, Sudoswap and more recently Blur also need filtering.
I realized that I had to make a marketplace-agnostic method.
As a quick aside – note that while a lot of the wash trading is caused by token incentives, it can also be driven by other motivations. For example, some collectors have used wash trading as a way to make their collection appear higher in various rankings. This issue became so serious that OpenSea had to make Solana NFT collections ineligible for their overall rankings as they worked on a solution.
How does the new method work?
We’ll be using 4 filters to identify odd trading behaviour that is most likely wash trading.
The goal of these filters is to be as transparent as possible, independent from any specific third party data, and most importantly open-source.
Let’s take a tour of the filters to see how they each work individually.
Filter 1: Buyer = Seller
On a smart contract level, it’s possible that the same wallet address is both the buyer and seller of an NFT.
Here are some example trades routed through popular marketplaces: on OpenSea, on LooksRare, on X2Y2 and on Blur.
This is very obviously inorganic trading behaviour. Trades where the buyer and seller are the same address are therefore filtered out.
Filter 2: Back & Forth Trades
One of the most common wash trading strategies has been to trade the same NFT between two different wallets, sending it back and forth.
So whenever a matching trade with seller and buyer inverted is found for the exact same NFT, it will automatically get flagged as a wash trade.
Filter 3: Bought NFTs 3x (Excluding ERC1155)
If the same address has had 3 or more buys of the same NFT (excluding ERC1155), it will get flagged as a wash trade.
Since some addresses have been seen trading the NFT through a chain of more than 2 wallets as a wash trading method, they go undetected by filter 2.
This should make sure to catch those and flag them appropriately.
If the same address appears to have bought or sold the same NFT 3x, those transactions will be labelled as wash trades.
Due to their semi-fungibility, ERC1155s are exempted from this filter.
One caveat is that some addresses engage in quick NFT flips/market-making (quickly buy and sell back for a small percentage of profit).
The chances of those addresses buying/selling the exact same ERC721 3x are very low but this issue is worth noting.
I believe that this filter’s importance outweighs its shortcomings. It could however benefit from some small tweaks and this is why I encourage everyone to get in touch with any feedback and suggestions.
Filter 4. Buyer & Seller First Funded by Same Wallet
Some wash trades are still able to get around the first 3 filters. However, there’s another way for us to weed them out.
In order to save themselves time, wallets used for wash trading will often be funded by the same wallet or by one another. Filter 4 will check, for every buyer and seller, who first funded the wallet with ETH.
If it happens to be the same wallet – or one another – then it’s flagged.
Please note that a list of addresses are excluded including this list of ~500 CEX addresses and all existing tornado cash smart contracts.
In order to easily look up who funded the buyer and seller in each sale, I made another publicly available table:
`addresses_events_ethereum.first_funded_by`
The code for this table can be seen here.
This is available for all to query and tells you, for each address, which address first funded it.
The surprising results
When we apply all these filters, the results are eye-opening.
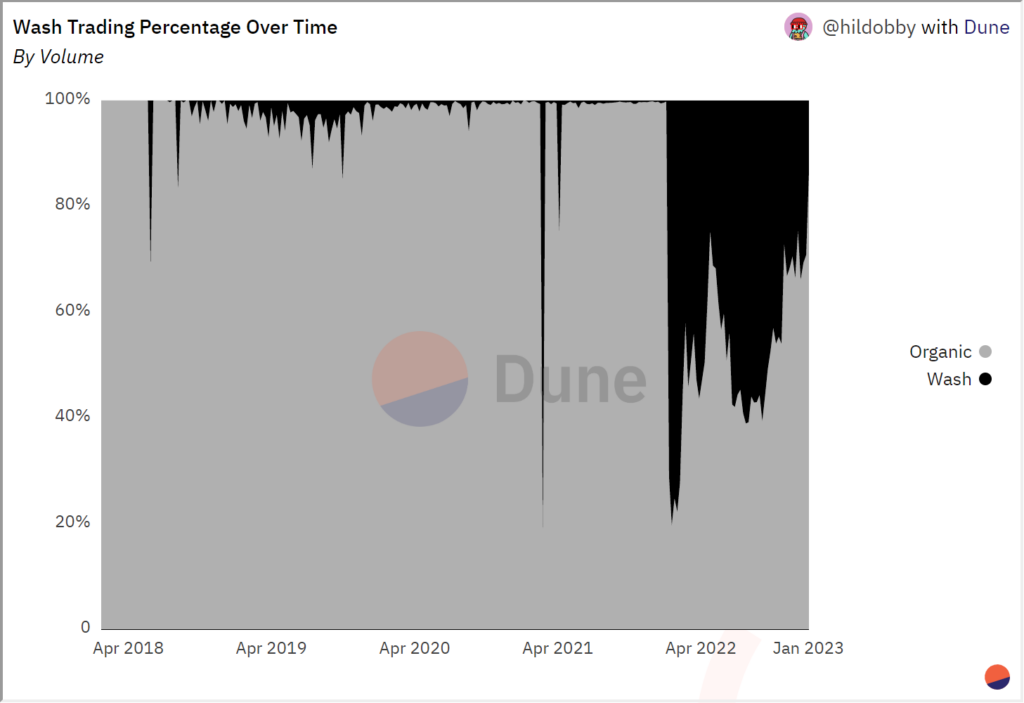
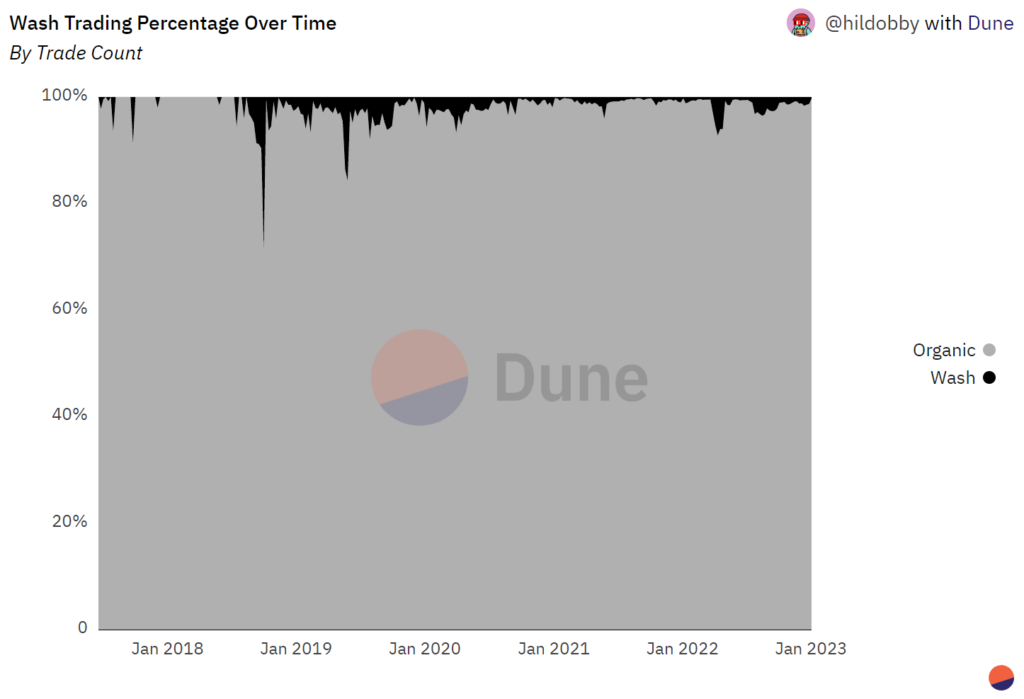
On Ethereum, wash trades are only 1.5% of all trades, but…….
Over $30B of NFT trading volume – almost 45% of the total – is from wash trading.
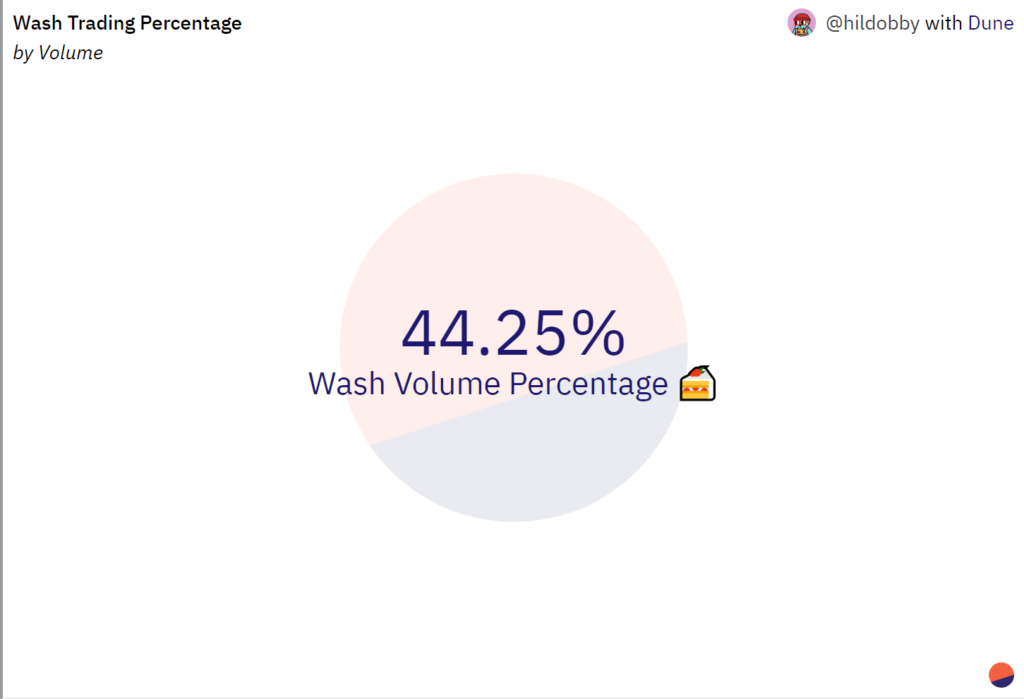
Almost half of the amazing “total trade volume” figures we often hear is just people gaming the system, and not legitimate trading.
This is a relatively new dynamic.
Wash trades made up a far higher % of total trades in the past, peaking at over 25% in late 2018.
In 2022 though they didn’t crack 10% of trades once, and generally remained ~1% of the total:
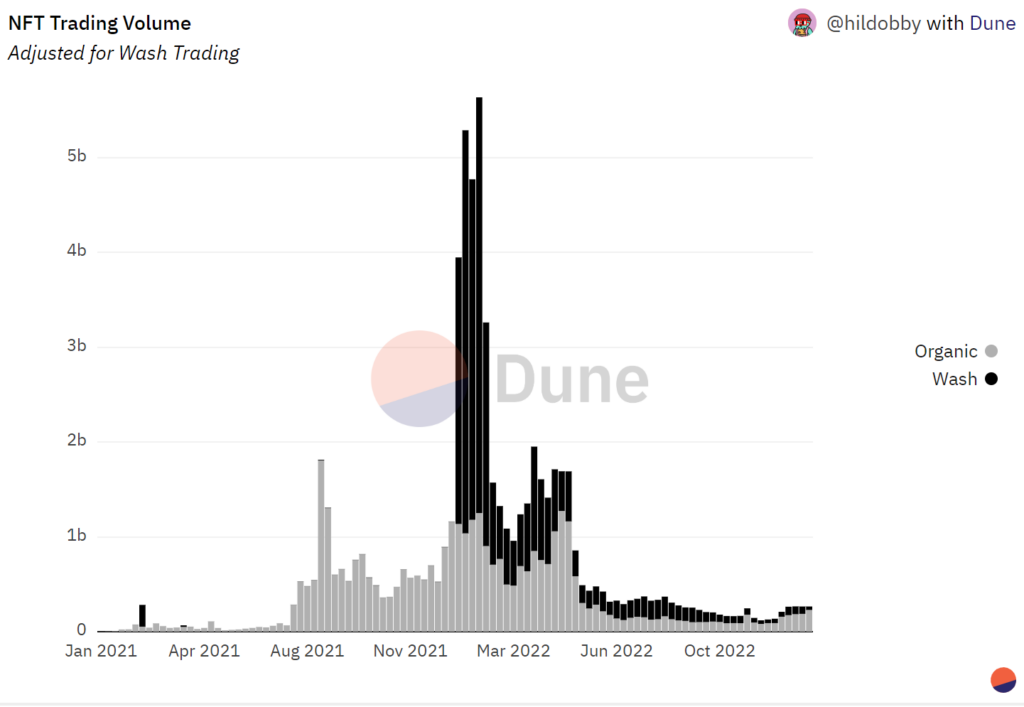
The picture changes entirely when it comes to volume.
Before 2022, wash trades had rarely accounted for more than 10% of volume, with a few notable spikes.
As the new year dawned though – wash trades as a % of total volume absolutely shot up.
Though they peaked in mid January at over 80%, throughout the year wash trades have consistently comprised a large chunk of the total:
Where is all this going down?
The wash trade ratio differs radically from platform to platform.
For some, like OpenSea, CryptoPunks & Foundation – wash trades are an insignificant contributor to their volume and transaction counts.
Others like LooksRare & X2Y2, on the other hand, are very dependent on wash trades for their volume – and have user bases with a high % of wash traders.
Check the different platforms out in this chart……

The vast majority of wash trading volume comes from LooksRare and X2Y2.
These two platforms are wash trade central – with 98% and 87% of their respective volumes driven by the activity.
While these two are almost completely dependent on wash trades for volume, note that only a (significant) minority of their total trades are washes – 25% for LooksRare and 22% for X2Y2.
When you consider that these two platforms are notorious for awarding tokens as an incentive for usage, those higher numbers will match the expectations of many.
Are there any other major culprits?
Element and Sudoswap are also popular wash trading destinations.
On Element, 66%+ of volume and 18.5% of trades are washes.
Sudoswap is a little less dependent, but can also thank wash traders for ~11% of volume and 14.5% of total trades.
Once again, this activity on these platforms is associated with their respective token airdrops.
Other marketplaces also have a small portion of their trades identified as wash trades. For example on OpenSea, wash trades account for only 2.4% of volume and under 1% of trades. For most others it’s even lower.
On these platforms, that do not directly incentivise usage, the wash trading is likely an attempt to cause certain collections to appear higher in stats rankings.
Some collections also offer rewards for trading, which provides another incentive.
I believe it is just as important for all of these to be filtered out, on every platform, when diving into NFT trading statistics.
The future of NFT wash trading
Let’s conclude with a summary and some thoughts…..
The NFT space is quickly evolving and maturing.
In 2022 it became ever more competitive, and it has become obvious that capturing trade volume market share is a top priority for platforms.
Well intentioned schemes to incentivise usage quickly emerged as a way to pull ahead in the race to attract this volume and become the most successful marketplace.
A byproduct of this has been the rise of wash trading, which is still in a legal gray area and distorts key metrics used by analysts to measure usage and performance.
Many widely quoted statistics have therefore been misleading at best, painting a picture of organic usage which hasn’t perfectly matched reality.
To put things back on track, the method above uses 4 filters to classify each NFT trade as organic or a wash trade. These filters flag $30B of NFT trading volume as wash trading, which represents ~45% of all trading volume on Ethereum.
All marketplaces see some degree of wash trading, but by far the worst affected are LooksRare, X2Y2, Element and Sudoswap.
What do these have in common? All have a token that is (or was) used as a trading incentive, making the culprit for those high inorganic numbers very clear.
Aside from the speculation that regulations are coming, there isn’t much currently stopping people from wash trading.
If serious regs do come, they may well succeed in reducing the amount of wash trading.
The problem is that they likely won’t apply in all jurisdictions, and we know that many bad actors either ignore or find some way to skirt the regulations anyways.
So, regardless of the future of this space, wash trading is sticking around for the long term.
I expect to see the approaches and techniques of the wash traders evolve over time, so this method may need to be updated in the coming months in order to remain futureproof.
If consensus is reached over an existing or new filter needing to be edited/added/removed, I will change the underlying wash trading data table accordingly.
To dive deeper, check out the dashboard that this analysis is based on – Ethereum NFTs Wash Trading 🧼. You’ll find all the charts shown above, and many more! It also contains detailed instructions on how you can easily use this filter yourself on Dune v2.